Private EquityScreenerRefer

MARKET INSIGHTS

  • EventsNEWPrivate market milestones
  • NewsPrecize daily pulse
  • BlogsIn-depth articles and opinions

GUIDES

Explore Now
  • Unlisted SharesStep-by-step · KYC
  • BuyingStep-by-step · KYC
  • SellingExit in 24 - 48 hours
  • Pre-IPOReturns · risks · case studies
  • Tax GuideBudget 2026 changes
  1. Home
  2. Shares
  3. Bharat Nidhi

Bharat Nidhi Unlisted Share Price Today

ISIN INE286F01016.

Bharat Nidhi is an India-based financial investment and holding company engaged primarily in investment activities and income generation from financial assets. The company’s revenue mix largely comprises interest income, dividend income, and share of profit from associate companies, rather than traditional operating or lending activities. Its earnings profile is therefore influenced more by portfolio performance and associate profitability than by core operating revenue. Bharat Nidhi follows…

Bharat Nidhi

Login for availability
Bharat Nidhi

Bharat Nidhi Unlisted Share Price Today

Current Price
Login for availability
Loading chart data...
SectorHolding Company
ISININE286F01016
Depository
Market Cap₹2,979.61 Cr
P/E Ratio6.59
ROE (%)10.4
Revenue₹27.78 Cr
Book Value15949.55
Debt to EquityN/A
Face Value10
52W High₹12542
52W Low₹1251
Market Cap₹2,979.61 Cr
P/E Ratio6.59
ROE (%)10.4
Revenue₹27.78 Cr
Book Value15949.55
Debt to EquityN/A
52W High/Low₹12542 / ₹1251
Face Value10
As of FY25

About the company & Industry

About Company

Bharat Nidhi is an India-based financial investment and holding company engaged primarily in investment activities and income generation from financial assets. The company’s revenue mix largely comprises interest income, dividend income, and share of profit from associate companies, rather than traditional operating or lending activities. Its earnings profile is therefore influenced more by portfolio performance and associate profitability than by core operating revenue.

Bharat Nidhi follows an investment-driven operating model, with a significant portion of its assets allocated to equity investments in associate entities. The company does not operate as a full-scale lending NBFC with a large loan book or diversified credit portfolio. Instead, its financial performance is closely linked to capital allocation decisions, dividend inflows, valuation movements, and profitability of investee companies. As a result, reported margins and return ratios may appear elevated due to investment income concentration.

Headquartered in New Delhi, India, Bharat Nidhi maintains a strong equity base and operates with a largely debt-free balance sheet at the consolidated level.

About Company

Bharat Nidhi is an India-based financial investment and holding company engaged primarily in investment activities and income generation from financial assets. The company’s revenue mix largely comprises interest income, dividend income, and share of profit from associate companies, rather than traditional operating or lending activities. Its earnings profile is therefore influenced more by portfolio performance and associate profitability than by core operating revenue.

Bharat Nidhi follows an investment-driven operating model, with a significant portion of its assets allocated to equity investments in associate entities. The company does not operate as a full-scale lending NBFC with a large loan book or diversified credit portfolio. Instead, its financial performance is closely linked to capital allocation decisions, dividend inflows, valuation movements, and profitability of investee companies. As a result, reported margins and return ratios may appear elevated due to investment income concentration.

Headquartered in New Delhi, India, Bharat Nidhi maintains a strong equity base and operates with a largely debt-free balance sheet at the consolidated level.

Financials

Revenue Volatility

Total revenue declined 24.04% YoY in FY25, indicating unstable top-line momentum.

Margin Expansion

EBITDA margin improved sharply to 80.15% in FY25 from 49.67% in FY24, reflecting strong operating leverage.

Earnings Instability

PAT swung from losses in FY21/FY23 to high volatility, with FY25 PAT at ₹452 Cr but historically inconsistent performance.
Income Statement

Revenue(Figures in Cr.)

Revenue Volatility

Total revenue declined 24.04% YoY in FY25, indicating unstable top-line momentum.

Margin Expansion

EBITDA margin improved sharply to 80.15% in FY25 from 49.67% in FY24, reflecting strong operating leverage.

Earnings Instability

PAT swung from losses in FY21/FY23 to high volatility, with FY25 PAT at ₹452 Cr but historically inconsistent performance.

Income Statement

Revenue(Figures in Cr.)

Competitive Position

Market Share

P/E Ratio

Financial Ratio Comparison (FY25)

Particulars
Bharat Nidhi
Shriram Finance Limited
Cholamandalam Investment & Finance
Revenue (₹ Cr)0.0041834.4225845.98
Revenue Growth (%)0.0019.6535.04
EBITDA Margin (%)60.8975.5070.66
Net Profit Margin (%)1628.9222.8816.29
ROE (%)10.4018.1719.69
Debt to Equity0.003.106.93
Leverage Ratio (x)0.000.598.52
Return on Assets (x)10.393.532.37
Revenue to Assets Ratio (x)0.010.140.12
ROCE (%)0.48--
ROA (%)10.39--
Cost of Funds (%)--8.51

Market Share

P/E Ratio

Financial Ratio Comparison (FY25)

Particulars
Bharat Nidhi
Shriram Finance Limited
Cholamandalam Investment & Finance
Revenue (₹ Cr)0.0041834.4225845.98
Revenue Growth (%)0.0019.6535.04
EBITDA Margin (%)60.8975.5070.66
Net Profit Margin (%)1628.9222.8816.29
ROE (%)10.4018.1719.69
Debt to Equity0.003.106.93
Leverage Ratio (x)0.000.598.52
Return on Assets (x)10.393.532.37
Revenue to Assets Ratio (x)0.010.140.12
ROCE (%)0.48--
ROA (%)10.39--
Cost of Funds (%)--8.51

Management

Shareholding PatternAs of FY26
Matrix Merchandise Limited
27.76%
Mr. Vineet Jain
27.29%
Sanmati Properties Limited
21.82%
Ashoka Marketing Limited
13.87%
Mahavir Finance Limited
9.26%

Key Managerial Personnel

As of FY26
NameDesignation and Experience
Mr. Bhagavatula Chintamani Rao
Director
Mr. Bhagat Ram Goyal
Director

Shareholding PatternAs of FY26
Matrix Merchandise Limited
27.76%
Mr. Vineet Jain
27.29%
Sanmati Properties Limited
21.82%
Ashoka Marketing Limited
13.87%
Mahavir Finance Limited
9.26%

Key Managerial Personnel

As of FY26
NameDesignation and Experience
Mr. Bhagavatula Chintamani Rao
Director
Mr. Bhagat Ram Goyal
Director
Coming Soon

Register to view prices and access exclusive investments.

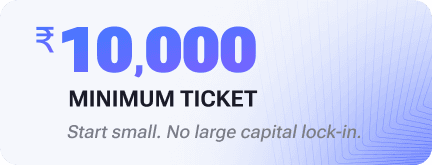
Minimum ticket ₹10,000 - Start small. No large capital lock-in.
Reserve Access
or
Continue with Google
Reserve Access

FAQs on Bharat Nidhi Unlisted Shares

What is the unlisted share price today?

unlisted share price is updated regularly on Precize. Visit Precize to check price movements and market trends.

How do I buy unlisted shares?

Register on Precize.in, complete KYC, select , enter quantity, and pay via UPI or NEFT. Shares are transferred within 24 hours.

What is 's revenue and profitability?

Please read these important legal notices and disclosures

None of the information displayed on or downloadable from https://www.precize.in represents an offer to buy or sell or a solicitation of an offer to buy or sell any security, nor does it constitute an offer to provide investment advice or service. Registered representatives of precize do not (1) Advise any member on the merits or advisability of a particular investment or transaction, or (2) Assist in the determination of fair value of any security or investment, or (3) Provide legal, tax, or transactional advisory services.

Read more

© 2026 Precize All Rights Reserved.

DECLARATION OF RISKTERMS OF USEPRIVACY POLICY
reported revenue of ₹27.78 Cr in FYFY25. PAT was ₹452.36 Cr. See full financials on this page.

What is the minimum investment for unlisted shares?

Minimum investment for unlisted shares starts from ₹10000. Please log in to view the latest pricing and availability