Turn Numbers into Action: How to Analyze Financial Performance

Sometimes looking at a company’s financial numbers can feel like staring at a puzzle you don’t know how to solve. You see the reports, the charts, and the ratios, but it’s hard to tell what they really mean for the business. Analyzing financial performance helps you make sense of these numbers, see where things are working, and spot areas that need attention.
In this blog, you will learn what financial performance analysis is, the key steps to do it right, common mistakes to avoid, and useful tools and resources to make the process easier and clearer.
Let’s get into it to learn!
At a Glance
Analyzing financial performance helps understand a company’s strengths, weaknesses, and overall financial health.
Key steps include collecting financial data, calculating ratios, performing trend and comparative analysis, and summarizing findings.
Common mistakes to avoid: relying on a single metric, ignoring cash flow, using incomplete data, and skipping visuals.
Tools like comparative statements, ratio analysis, trend analysis, and scenario planning make the process easier.
Platforms like Precize offer Private Equity and Private Credit opportunities, along with detailed financial reports to support informed decisions.
What Is Financial Performance Analysis?
Financial performance analysis is the process of evaluating a company’s financial health using its financial statements and key metrics. It shows how well a business manages its resources, generates revenue, and controls costs. This analysis helps identify strengths, weaknesses, and areas for improvement. It provides a clear view of the company’s overall financial condition.
Now that the importance and scope of financial performance analysis are clear, let’s explore the key steps you should follow to get meaningful insights.
6 Steps to Analyze Financial Performance
When you want to understand a company’s financial health, following a clear process makes analyzing financial performance much easier and more accurate. Here’s how you can approach it:
Step 1: Define Your Purpose
Begin by identifying what you want to achieve.
Are you checking how efficiently the company generates profits, whether it can cover short-term obligations, or how well it uses its assets?
Your goal will guide which data and ratios you need to focus on.
Step 2: Gather Financial Data
Collect the company’s financial statements, such as the balance sheet, income statement, and cash flow statement. These documents provide the core numbers needed for analysis.
Step 3: Examine Key Financial Ratios
Use financial ratios to get a deeper insight into performance:
Profitability Ratios: See how well revenue is turning into profit (for example, net profit margin).
Liquidity Ratios: Check the company’s ability to meet short-term liabilities (for example, current ratio).
Solvency Ratios: Evaluate long-term stability and debt levels (for example, debt-to-equity ratio).
Efficiency Ratios: Understand how effectively assets are being used (for example, inventory turnover).
Market Ratios: Get an idea of market perception and value (for example, price-to-earnings ratio).
Step 4: Conduct Comparative Analysis
Compare your findings with previous periods of the same company to spot trends.
You can also benchmark against competitors or industry standards to see where the company stands in its market.
This helps identify both strengths and weaknesses.
Step 5: Interpret the Results
Look at the numbers and understand what they indicate about the company’s financial condition.
Pinpoint areas that are performing well and those that may need improvement, such as reducing debt or optimizing asset use.
Step 6: Summarize Your Findings
Present the results in simple, clear language.
Highlight key takeaways and use charts or tables if it makes the information easier to grasp.
A clear summary ensures the analysis is actionable and easy to understand.
Once you’ve gone through the analysis steps, knowing what pitfalls to avoid can help ensure your findings are accurate.
Common Mistakes to Avoid for Financial Performance Analysis
When you’re analyzing financial performance, avoiding common pitfalls can make your insights much more useful and reliable. Here are some key mistakes to watch out for:
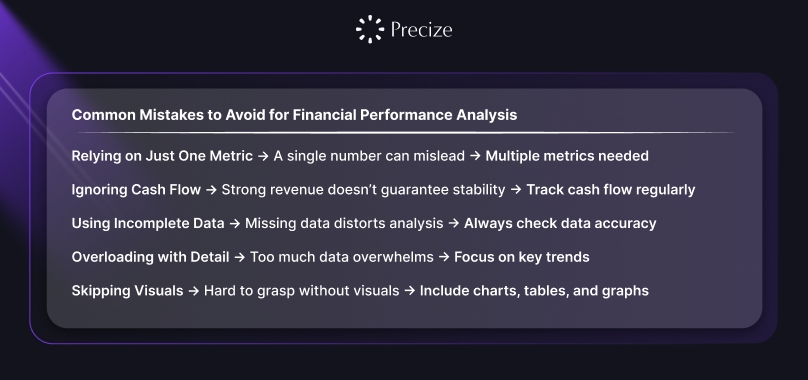
Relying on Just One Metric
Looking at only one number, like revenue or profit, can be misleading. To really understand the company’s health, you need to consider multiple metrics together.
Ignoring Cash Flow
Cash flow shows if the business can manage day-to-day operations smoothly. Even strong revenue doesn’t guarantee stability, so don’t overlook this crucial metric.
Using Incomplete or Wrong Data
Always make sure your data is accurate and complete. Missing numbers or errors in the balance sheet, income statement, or cash flow statement can lead to wrong conclusions.
Overloading with Too Much Detail
Including every tiny piece of data can be overwhelming. Focus on key numbers and trends, and summarize similar information so it’s easier to follow.
Skipping Visuals
Charts, tables, and graphs make it much easier to spot trends and compare results. Without them, your analysis can feel dry and hard to understand.
Not Thinking About Your Audience
Different readers want different things. Tailor your analysis to their needs and use simple, clear language so everyone can follow your findings.
Missing an Executive Summary
Start with a short summary of your main points and recommendations. This helps anyone reading your analysis grasp the essentials quickly without getting lost in the details.
With common errors out of the way, the next step is to explore practical tools and resources that help you interpret financial data with confidence.
Tools and Resources for Financial Performance Analysis
When you’re analyzing financial performance, using the right tools and resources can make the process much clearer and more effective. Here are some key methods to consider:
Comparative Statements: These show financial data from different periods side by side, helping you spot changes in revenue, expenses, and other key figures over time.
Common Size Statements: By presenting each item as a percentage of a total, like sales or assets, these statements make it easier to compare companies of different sizes.
Cash Flow Analysis: Examining cash inflows and outflows helps you understand how much cash is available for daily operations and other needs.
Ratio Analysis: Using financial ratios lets you evaluate performance across areas like profitability, liquidity, and efficiency. Ratios provide a quick snapshot of strengths and weaknesses.
Trend Analysis: Looking at financial data over multiple periods helps you identify patterns and trends that could affect decisions.
Scenario and Sensitivity Analysis: These methods show how changes in key variables, such as costs or sales, could impact financial health, helping you prepare for different situations.
Conclusion
Analyzing financial performance helps you understand a company’s health, identify strengths and weaknesses, and make informed decisions based on clear data. By following the steps outlined, collecting financial data, calculating ratios, performing trend and comparative analysis, and summarizing findings, you can get a complete picture of how resources are managed and where improvements are needed.
Platforms like Precize make this process easier. With private equity, you can explore private companies, buy and sell unlisted or pre-IPO shares, and access detailed research reports, including balance sheets, income statements, cash flow statements, and industry comparisons. Private credit offers global finance opportunities, providing alternative fixed-income options.
Reserve access today to build a diversified portfolio and gain deeper insights into financial performance across multiple opportunities!
FAQs
1. What financial ratios are most important for analyzing financial performance?
The key ratios include profitability ratios like net profit margin, liquidity ratios such as current ratio, efficiency ratios like inventory turnover, and solvency ratios like debt-to-equity. These give a clear view of different aspects of a company’s financial health.
2. How often should financial performance be checked?
It’s best to review financial performance regularly, such as quarterly or annually. Regular checks help spot trends, manage cash flow, and catch issues early.
3. Can small businesses benefit from financial performance analysis?
Yes. Even small businesses can see how resources are used, track expenses, and improve efficiency by analyzing their financial performance.
4. Which tools make financial performance analysis easier?
Tools like Precize, create comparative statements and show trends clearly.
5. How does trend analysis help in understanding financial performance?
Trend analysis looks at financial data over time to identify patterns in revenue, costs, and other metrics. It helps understand growth trends and plan for future improvements.
Disclaimer
This blog is intended to provide information and guidance on analyzing financial performance, including key steps, ratios, tools, and resources. It is meant for educational purposes only and does not constitute financial, legal, or professional advice. Always use your own judgment, verify information, and conduct further research before making any financial decisions.

Stay in the Loop
Join our newsletter for exclusive access to thoughtfully curated content and we promise, no spam


Company
Our Office
Office No. 1219, The Summit Business Park, Andheri Kurla Road, Andheri East, Mumbai, Maharashtra - 400093
Find us on Googlesupport@precize.in
+91 7738336457
All trademarks and logos or registered trademarks and logos found on this Site or mentioned herein belong to their respective owners and are solely used for informational and educational purposes.
The material presented in this advertisement is for informational purposes only and should not be construed as investment advice or investment availability. It is not a recommendation of, or an offer to sell or solicitation of an offer to buy, any particular unlisted share, security, strategy, or investment product. Investing in the private market and securities involves risks, including the potential loss of money, and past performance does not guarantee future results. Market trends, data interpretations, graph projections are provided for informational and illustrative purposes and may not reflect actual future performance. Nothing on this website should be construed as personalized investment advice or should not be treated as legal, financial, or any other form of advice. Precize is not liable for financial or any other form of loss incurred by the user or any affiliated party based on information provided herein.
Precize is neither a stock exchange nor does it intend to get recognized as a stock exchange under the Securities Contracts Regulation Act, 1956. Precize is not authorized by the capital markets regulator to solicit investments. The securities traded on these platforms are not traded on any regulated exchange.
The website will be updated regularly.
Copyright © 2026 - Precize - All Rights Reserved