On April 1, 2026, the Metropolitan Stock Exchange of India (MSEI) - active in equities, derivatives, currency, and debt, but long a quiet third exchange next to the NSE and BSE - recorded a sharp one-day jump in traded quantity and rupee value. Institutions and retail readers alike are asking whether this is a lasting step-change or a maker-driven spike.
MSEI trading volume April 2026: The headline numbers
The most direct way to see why MSEI trading volume in April 2026 mattered is to compare the day of the surge with the prior baseline (as reported in exchange data and follow-on commentary).
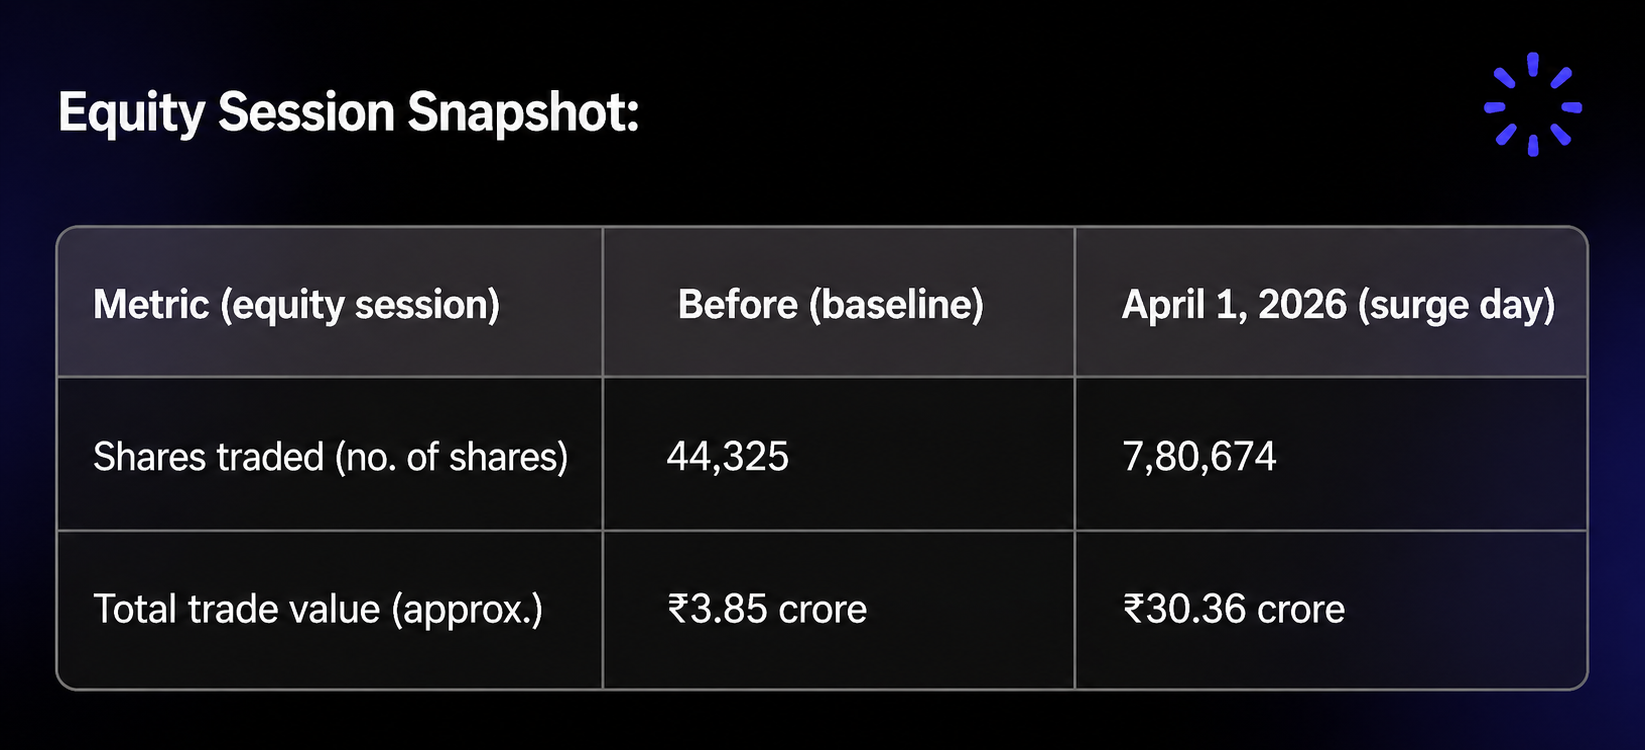
Volume rose by a large multiple—often described in round terms as an ~18x jump in share count. Turnover moved up roughly 8x in rupee terms. Those two facts sit together: You can have a big multiple in shares and a smaller multiple in rupees when average trade sizes and prices shift alongside participant behaviour.
For analysts, the signal is less “markets were hot” and more “trading density changed fast.” When an exchange has run at a low base for a long time, a single-day move of this scale usually points to a defined catalyst—not a slow drift in retail enthusiasm.
What is MSEI (and why liquidity is the product)?
The Metropolitan Stock Exchange of India (MSEI) operates as a stock exchange under India’s market framework, alongside the National Stock Exchange (NSE) and Bombay Stock Exchange (BSE). It offers multiple segments, but equity turnover and ecosystem depth are where exchanges are most often ranked in public discussion.
An exchange is not only technology and regulation; it is also liquidity. Without tight spreads and reliable depth, brokers, proprietary desks, and arbitrage players have less reason to route flow. That is why structural programmes such as market making matter: They are designed to change participation and quoting behaviour, not just marketing visibility.
Why market makers shifted MSEI trading volume in April 2026
The primary catalyst described for the April activity is the activation of market makers on MSEI’s equity segment. Market makers commit to continuous bid and offer quotes, which tends to:
Tighten spreads, reducing impact cost for others hitting the book.
Stabilise visible depth, so participants can size orders with more confidence.
Seed a network effect: better quotes can attract more intermediaries, which can in turn attract HFT and arbitrage interest if the flow persists.
MSEI has positioned the initiative as a structural effort rather than a one-day promotion. The open question always is whether day-one prints turn into a sustained average for trade value and diversity of participants, or whether activity concentrates around market-making obligations in ways that look strong on the tape but do not yet reflect broad, organic demand.
MSEI Financials: 9MFY26 and Operating Leverage
The April 1 session does not sit in a vacuum. In 9MFY26 financial highlights (as cited in prior analysis of the exchange’s trajectory), the direction of travel in losses mattered as much as any single day’s turnover:
EBITDA loss narrowed sharply year-over-year: From ₹23.08 crore in 9MFY25 to ₹5.32 crore in 9MFY26 (roughly 78% improvement in loss magnitude).
PAT loss also narrowed: From ₹27.04 crore to ₹11.68 crore (about 57% improvement).
Exchange economics often show high operating leverage: Fixed technology, compliance, and infrastructure costs are heavy, while incremental trading and clearing fees can fall through at high margin once scale is credible. That is why a ₹30 crore (order of magnitude) daily trade value handle is discussed as a milestone: if similar levels become routine, they support the path toward covering fixed costs and, eventually, profitability but if volumes mean-revert, the financial story reverts with them.
Always cross-check these figures in the latest official filings and presentations, as exchange reporting can update with new periods.