PharmEasy Parent API Holdings Q3 FY26: EBITDA Turnaround

What is EBITDA, and why investors lead with it here
EBITDA is earnings before interest, tax, depreciation, and amortization. Think of it as a middle-layer profitability measure: it strips out some accounting and capital-structure effects so you can see whether the core business model is close to making money on operations alone.
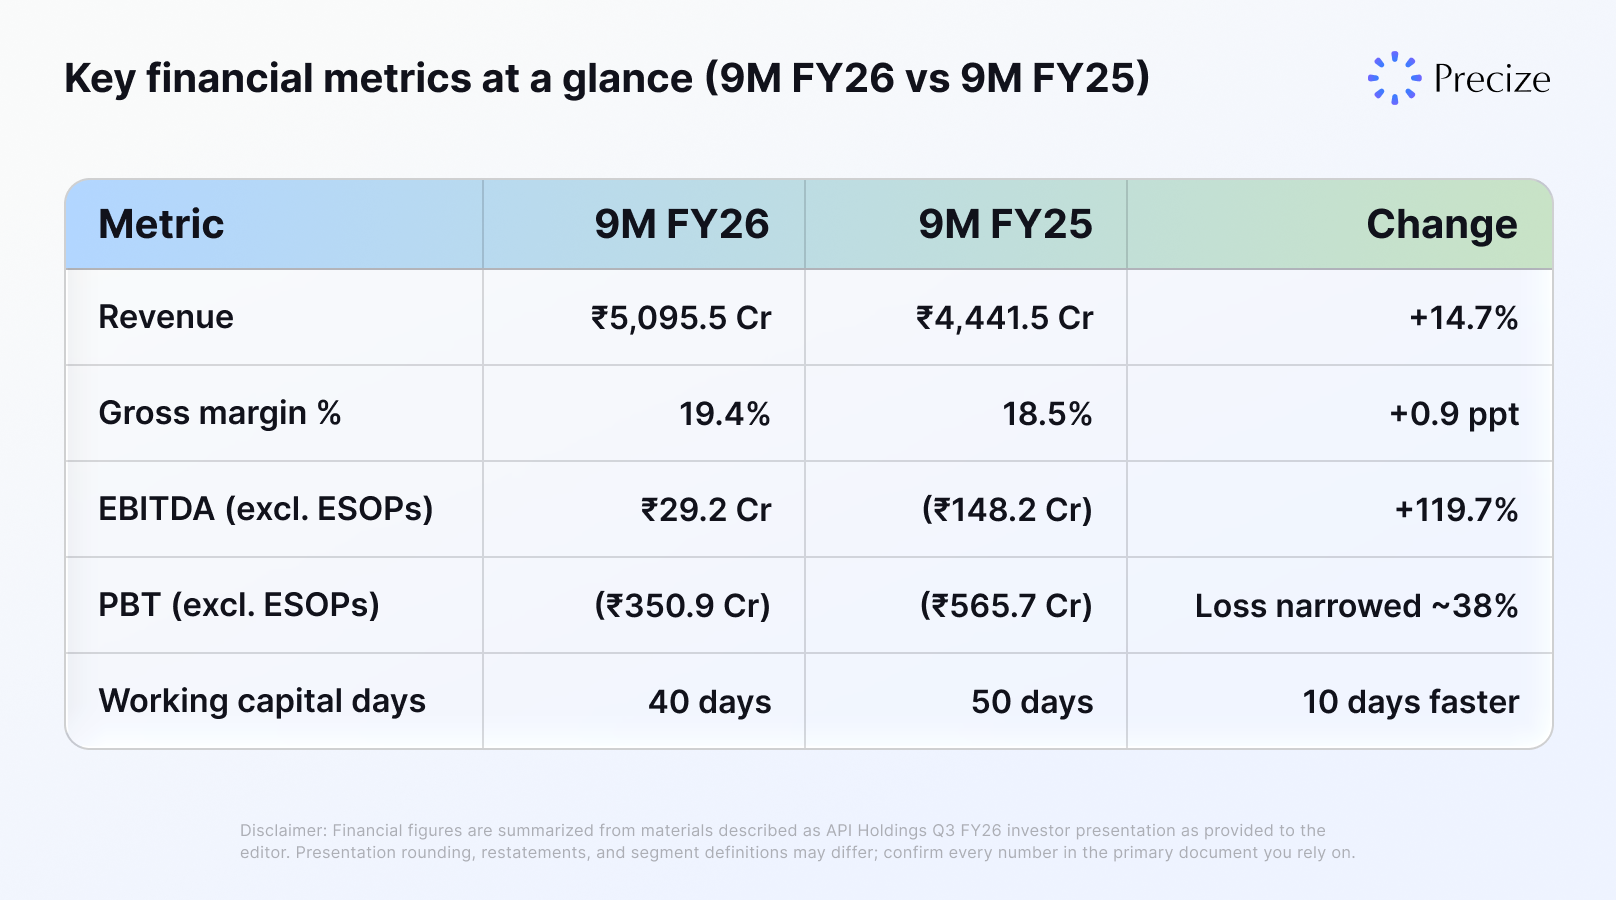
It is not cash profit. A company can show positive EBITDA and still face interest costs, working capital swings, and capital spending that keep overall losses wide. That context matters for API Holdings, because profit before tax (PBT) excluding ESOPs was still negative at ₹350.9 Cr. in 9MFY26, even though it narrowed from ₹565.7 Cr. in 9MFY25.
PharmEasy Q3 FY26 results: revenue, Opex, and group EBITDA
Revenue growth with tighter cost intensity:
For 9MFY26, API Holdings reported ₹5,095.5 Cr. in revenue versus ₹4,441.5 Cr. in 9M FY25. That is a healthy mid-teens growth rate for a large healthcare platform that has already gone through a painful consolidation phase in Indian digital health.
Opex behavior is the other half of the puzzle:
Total Opex dipped slightly on a YoY basis (about 1.4% lower in 9MFY26 versus 9MFY25). When revenue rises and Opex does not rise with it, Opex as a percentage of revenue usually improves. Here, that ratio moved from 21.8% to 18.8%, which is a meaningful step for a business that historically funded growth through heavy spending.
In plain terms: the company is trying to prove it can grow the top line without automatically re-inflating the cost base.
Segment snapshot for PharmEasy Q3 FY26 (API Holdings)
1) Diagnostics (Thyrocare and PharmEasy diagnostics):
Diagnostics is the highest-quality margin pocket in many healthcare platforms because tests can carry strong gross margins when collection, logistics, and lab utilization are run well.
For 9MFY26, diagnostics revenue was ₹605.1 Cr., with the presentation citing 20%+ revenue growth. Gross margin was 73.1%, and EBITDA margin for the segment was 33.2%. That combination usually points to scale in the lab network, better utilization, and pricing or mix that is not purely a race to the bottom.
2) B2B distribution to retailers (Ascent):
This segment distributes medicines and related products to chemists and institutions. It is structurally sensitive to credit cycles, inventory turns, and competition from other distributors.
The update that gets attention is profitability timing: Q3 FY26 EBITDA was ₹38 Mn positive, compared with a ₹1,104 Mn EBITDA loss for the full FY25 (as cited in the presentation). A single quarter does not seal a long-term turnaround, but it is a milestone that supports the broader narrative that B2B economics are being repaired, not just masked.
3) Hospital supplies (Aknamed):
Hospital distribution is still EBITDA-negative, but the presentation highlights a large reduction in losses versus the prior-year comparable period, alongside a sharp Opex reduction (cited around 71.9% lower Opex for 9MFY26 versus 9MFY25 in the materials summarized here). That reads like a deliberate reset: fewer low-quality accounts, tighter fulfillment economics, or a smaller operating footprint, depending on execution details in the full deck.
Key financial metrics at a glance (9M FY26 vs 9M FY25)
Balance sheet and cash signals the presentation emphasizes
Two items help investors connect EBITDA improvement to durability:
Working capital days improved by 10 days (50 to 40). Faster working capital often means less cash trapped in receivables and inventory, though it needs to be sustained without hurting growth.
Finance costs were lower by about 13.8% in 9MFY26 versus the comparable period, which can reflect refinancing, lower debt balances, or rate mix, depending on disclosures in the full pack.
If you are new to reading healthcare conglomerate decks, the Precize blog includes educational pieces that break down how listed and unlisted disclosures differ, and what to verify before you act.
What this means if you follow PharmEasy as an unlisted / pre-IPO narrative
A stronger middle-layer profit story can matter for how the market prices private shares, but it is not the whole picture. You still want clarity on:
Sustainability of Opex discipline if the company pushes growth harder again.
Segment mix: diagnostics can help margins, but B2B and hospital supply economics can swing with credit and competition.
Capital structure: EBITDA can improve while absolute debt service and covenants remain the real constraint for equity holders.
SEBI publishes investor education material on reading company disclosures; see SEBI for the official library. For platform basics on private markets, see FAQs on unlisted shares.
Bottom line
PharmEasy Q3 FY26 results for the API Holdings group read as a credible path-to-profitability chapter: double-digit revenue growth, Opex ratio improvement, and segment-level milestones in diagnostics and B2B. The open question for the next few quarters is whether management can keep cost intensity contained while defending share in competitive channels.
If you want to compare private-market opportunities with clearer peer context, start from the Precize homepage, then use the Precize screener and read company-specific notes alongside official filings.
Disclaimer: This content is for informational purposes only and does not constitute investment advice. Investing in unlisted shares involves risks including illiquidity and potential loss of capital. Consult a qualified financial advisor before making investment decisions. Precize is not a stock exchange and is not regulated by SEBI. This is not a recommendation to buy or sell any security related to API Holdings or PharmEasy; do your own research before investing.
Past performance does not guarantee future results. Returns on unlisted shares are not guaranteed.

Stay in the Loop
Join our newsletter for exclusive access to thoughtfully curated content and we promise, no spam


Company
Our Office
Office No. 1219, The Summit Business Park, Andheri Kurla Road, Andheri East, Mumbai, Maharashtra - 400093
Find us on Googlesupport@precize.in
+91 7738336457
All trademarks and logos or registered trademarks and logos found on this Site or mentioned herein belong to their respective owners and are solely used for informational and educational purposes.
The material presented in this advertisement is for informational purposes only and should not be construed as investment advice or investment availability. It is not a recommendation of, or an offer to sell or solicitation of an offer to buy, any particular unlisted share, security, strategy, or investment product. Investing in the private market and securities involves risks, including the potential loss of money, and past performance does not guarantee future results. Market trends, data interpretations, graph projections are provided for informational and illustrative purposes and may not reflect actual future performance. Nothing on this website should be construed as personalized investment advice or should not be treated as legal, financial, or any other form of advice. Precize is not liable for financial or any other form of loss incurred by the user or any affiliated party based on information provided herein.
Precize is neither a stock exchange nor does it intend to get recognized as a stock exchange under the Securities Contracts Regulation Act, 1956. Precize is not authorized by the capital markets regulator to solicit investments. The securities traded on these platforms are not traded on any regulated exchange.
The website will be updated regularly.
Copyright © 2026 - Precize - All Rights Reserved