
OYO FY26: Key Financial Highlights
OYO operates a technology-enabled hospitality platform with 22,700+ hotels across 35+ countries. Its hybrid business model combines technology, franchising and direct operations, allowing it to bridge traditional hotel chains and digital booking platforms.
The company delivered strong improvement across key financial metrics in FY26:
Revenue grew 49.7% YoY
PAT increased 306.1% YoY
EBITDA surged 160.1%
EBITDA margin reached 30.8%
ROE improved to 20.76%
ROCE increased to 10.78%, compared with 6.57% in FY25
The sharp increase in EBITDA and PAT indicates that OYO's revenue growth has translated into a significant improvement in profitability.
OYO's Profitability Shows a Strong Turnaround
One of the biggest highlights of FY26 is the improvement in profitability.
PAT increased by 306.1% YoY, while ROE almost doubled from 10.45% in FY25 to 20.76% in FY26. ROCE also improved substantially from 6.57% to 10.78%.
This suggests that the company's improved financial performance is not limited to topline growth. The expansion in operating profitability and return ratios points toward better operating efficiency and capital utilisation.
Proposed ₹6,650 Crore OYO IPO
The next major potential catalyst for OYO is its proposed ₹6,650 crore IPO.
PRISM, the parent company of OYO, has publicly filed its Updated Draft Red Herring Prospectus (UDRHP-1) with SEBI for the proposed issue. The filing represents an important regulatory milestone and brings the company closer to its long-awaited stock market debut.
A key aspect of the proposed IPO is the potential use of fresh capital for debt repayment or prepayment. If executed as outlined, this could strengthen OYO's balance sheet and reduce financial leverage.
OYO Financial Ratios: FY26 vs FY25
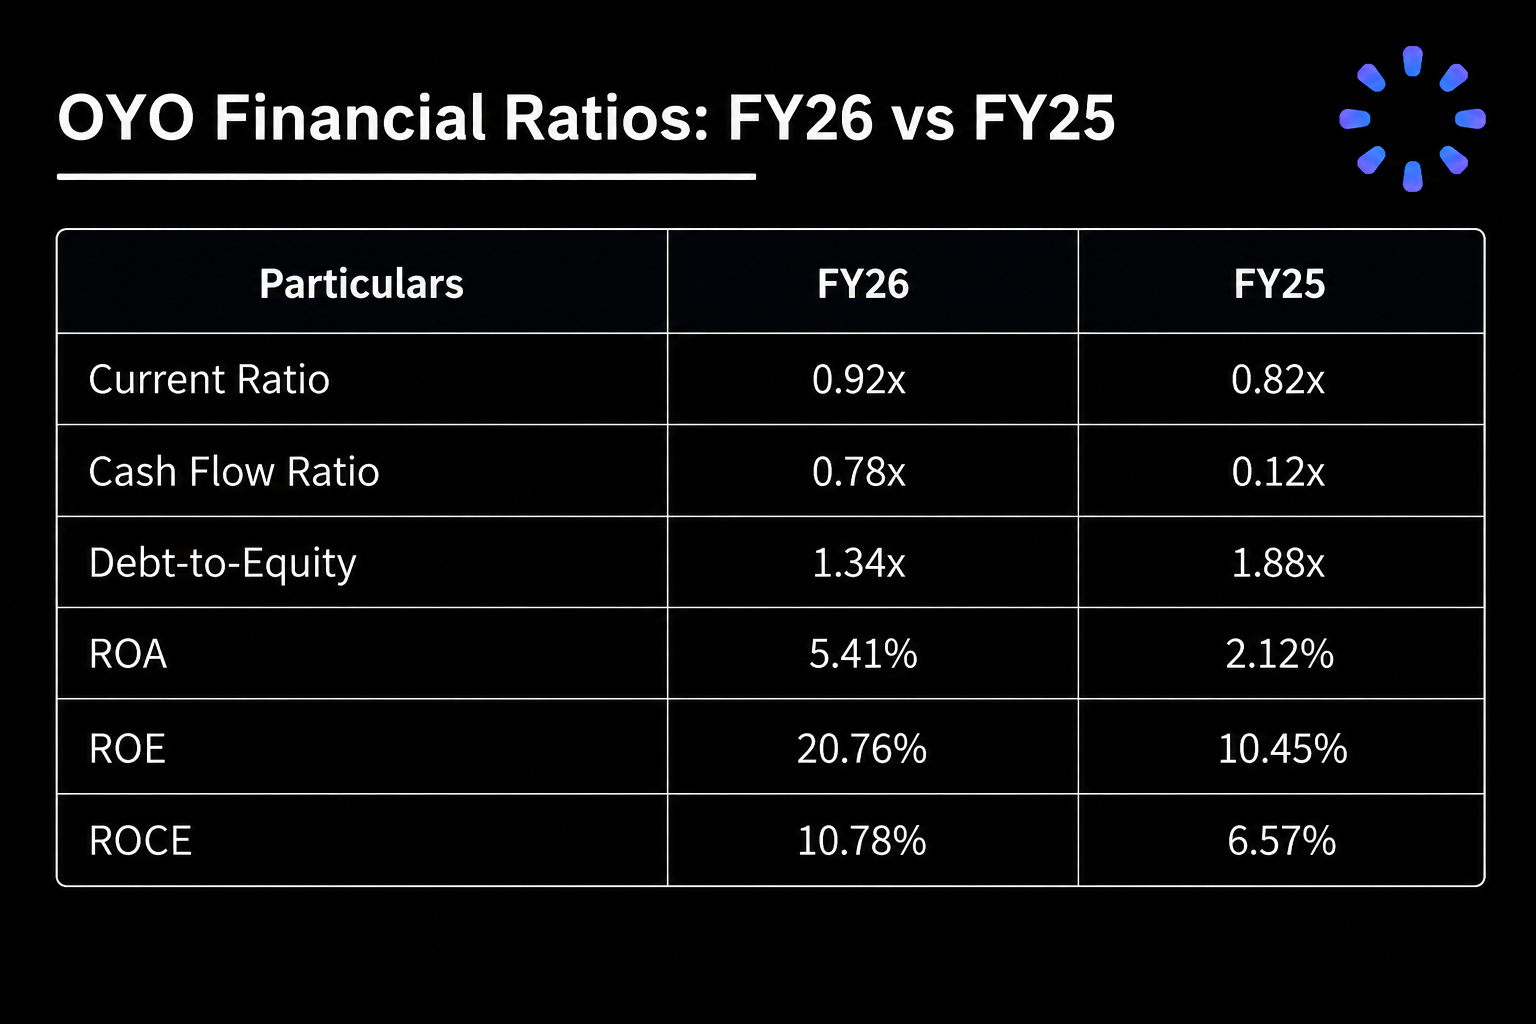
The numbers show improvement across several important indicators. Debt-to-equity declined from 1.88x to 1.34x, while ROA, ROE and ROCE all improved.
International Business Remains Important
OYO has a significant international presence, with 83.9% of revenue coming from international markets and 16.1% from India.
This global exposure provides access to a larger hospitality market, but it also creates exposure to currency movements and economic conditions across international markets. Investors therefore need to consider both the growth opportunity and the risks associated with geographical diversification.