The Stock Market Secret: Understanding EPS Like a Pro

When you follow the stock market, you often hear numbers that seem to decide whether a company is doing well or not. One of the most common among them is EPS in the stock market. It’s a figure that regularly comes up in financial news, annual reports, and analyst discussions, making it something you can’t ignore if you want to understand company performance.
In this blog, you’ll learn everything about EPS in the stock market, from its meaning, calculation, and types to its importance. We’ll also look at how it compares with other financial metrics, the factors that affect it, and its limitations, giving you a complete understanding of EPS in company evaluation.
Let’s get into it!
Overview
The EPS full form in the stock market is Earnings Per Share, showing profit earned for each share.
It is calculated as (Net Profit – Preference Dividends) ÷ Outstanding Equity Shares.
Different types include Basic, Diluted, Trailing, Forward, Reported, and Cash EPS.
EPS is important for measuring profitability, comparing companies, and forming the P/E ratio.
EPS has limitations and can sometimes be influenced by accounting practices.
What is EPS in the Stock Market?
In the stock market, EPS stands for Earnings Per Share. It is a key financial measure that shows how much of a company’s net profit is attributed to each outstanding equity share. EPS shows the profit a company earns for each of its shareholders and is often used to measure profitability and compare how different companies perform within the same industry.
Knowing what EPS stands for is only the start; let’s see how you can calculate it in practice.
How EPS is Calculated (Formula and Example)
The calculation of EPS is straightforward and helps you understand a company’s profit in relation to its shares. The basic EPS formula is:
EPS = (Net Profit – Preference Dividend) ÷ Number of Outstanding Equity Shares
Net Profit: The company’s profit after tax.
Preference Dividend: The dividend that needs to be paid to preference shareholders, if any.
Outstanding Equity Shares: The total number of equity shares currently held by shareholders.
Example:
Suppose a company earns ₹50 crore in net profit during a year and pays ₹5 crore as preference dividend. If the company has 9 crore outstanding equity shares, then:
EPS = (50 – 5) ÷ 9 = ₹5 per share
This means the company has earned ₹5 for each share in that year.
EPS isn’t always presented in the same way. After the calculation, it’s important to understand the different types that exist and what they mean.
Types of Earnings Per Share

When you look at EPS, you’ll notice that there are different types, and each one shows company performance from a slightly different angle. Here are the main ones you should know:
1. Basic EPS
Basic EPS is the most straightforward type. It is determined by dividing the company’s net profit by the total number of its outstanding common shares.
It doesn’t include possible future shares from things like employee stock options or convertible bonds.
This gives you a direct idea of profit earned per share for existing shareholders.
2. Diluted EPS
Diluted EPS includes not just current shares but also potential shares that could be created in the future, such as from stock options or warrants.
Since profits are spread across more shares, diluted EPS is usually lower than basic EPS.
It shows what earnings per share would look like if all possible shares were issued.
3. Reported EPS (GAAP EPS)
Reported EPS, also called GAAP EPS, is the figure published in the company’s official financial statements.
It follows accounting rules but may sometimes be affected by one-time gains or unusual items, which means it might not always reflect everyday business earnings.
4. Ongoing EPS (Pro Forma EPS)
Ongoing EPS, or Pro Forma EPS, removes irregular or one-off items from the profit. It focuses only on recurring business earnings, helping you see how much a company makes from its core activities without unusual income or losses.
5. Retained EPS
Retained EPS shows the part of profit that the company keeps instead of giving out as dividends. This amount is usually set aside for expansion, new projects, or paying off debts.
6. Cash EPS
Cash EPS is based on actual cash flow from operations divided by diluted shares.
Unlike accounting profits, this number is harder to adjust or manipulate.
It shows the real cash earnings per share, making it useful for understanding financial strength.
7. Book Value EPS
Book Value EPS comes from the company’s balance sheet. It represents the equity value per share, giving you an idea of what each share might be worth if the company were liquidated.
8. Trailing EPS and Forward EPS
Trailing EPS is calculated from actual profits made in the last 12 months, giving you a view based on past performance.
Forward EPS is based on future earnings estimates, often provided by analysts or company management, to show expected profit per share in the coming months or years.
With the types clear, it’s time to look at why EPS carries so much importance when evaluating companies in the stock market.
Importance of EPS in the Stock Market

In the stock market, EPS plays a central role in showing how a company is performing and why it matters to shareholders. The following are the key reasons why EPS is important:
Measure of Profitability
EPS is a direct way to see if a company is making good profits. A higher EPS means more earnings per share. If you notice EPS increasing over time, it usually reflects steady business growth.
Tool for Comparison
EPS helps you compare companies in the same industry. For example, if two businesses operate in the same sector but one shows a higher EPS, it’s often seen as the stronger performer in terms of earnings.
Indicator of Financial Health
EPS gives you a quick snapshot of how financially strong a company is. Analysts and market watchers often rely on this number to judge whether a business is on the right path.
Impact on Share Price
Company share prices are often linked to EPS. A strong EPS report can attract more interest in the shares, while a decline in EPS may have the opposite effect.
Basis for Valuation
EPS is a key input for valuation ratios, especially the Price-to-Earnings (P/E) ratio. The P/E ratio compares a company’s share price with its earnings, helping you see if the stock is priced high or low compared to its profits.
Connection with Dividends
Companies with steady or growing EPS are often in a better position to distribute dividends, since there is more profit available to share with shareholders.
EPS explains a lot about profits, but it works best when compared with other financial metrics that highlight different aspects of a company’s performance.
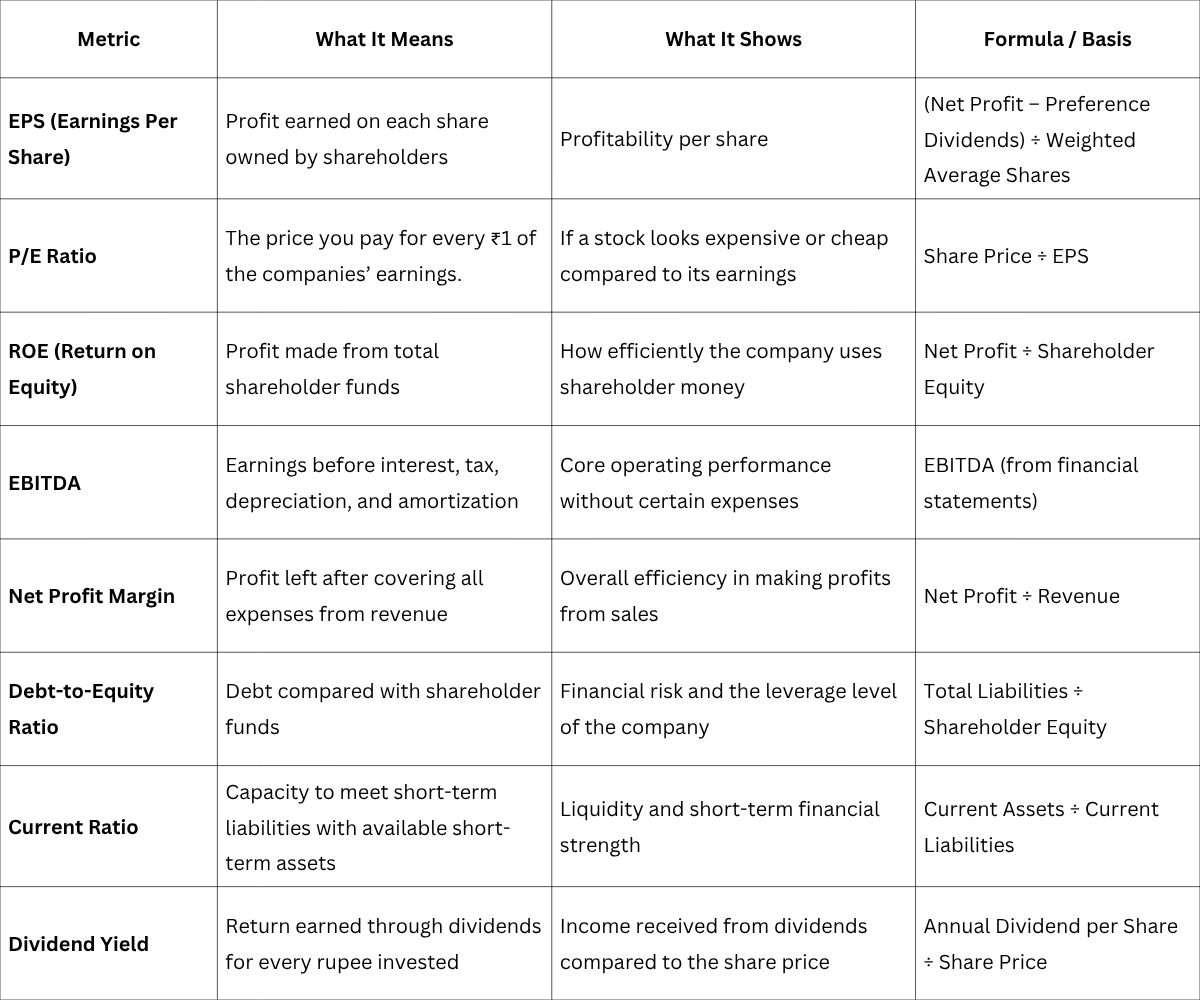
EPS vs Other Financial Metrics
When you study a company’s performance, EPS alone doesn’t give the full picture. It needs to be looked at alongside other financial metrics that highlight profitability, efficiency, liquidity, and overall financial health. Here is the table that shows how EPS compares with other key metrics:
To get a deeper understanding of EPS beyond comparisons, let’s look at the major factors that affect it.
Key Factors Affecting Earnings Per Share
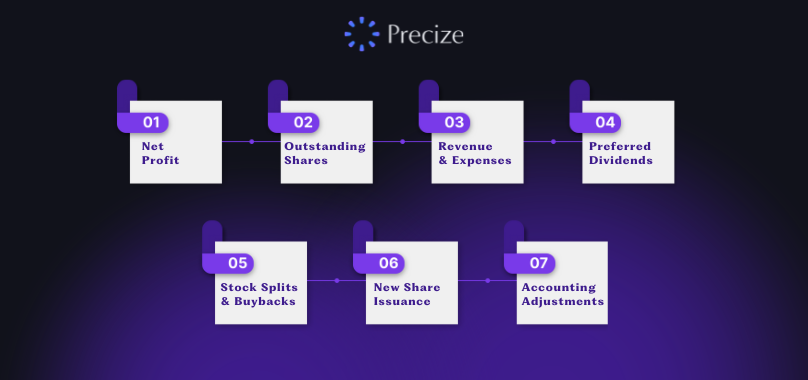
When you look at EPS, it’s important to understand that many factors can change this number. Here are the main ones you should know:
Net Profit: The biggest influence on EPS is the company’s net profit. If profits rise, EPS usually goes up. If profits fall, EPS comes down as well.
Number of Outstanding Shares: Since EPS is calculated by dividing profit by the total number of shares, changes in share count affect it. If more shares are issued, EPS may drop. If the company buys back its own shares, the reduced share count can increase EPS.
Revenue and Expenses: Stronger sales or lower costs can improve profits, which in turn raise EPS. On the other hand, lower sales or higher expenses can reduce EPS.
Preferred Dividends: Before calculating EPS, dividends paid to preference shareholders are subtracted from net profit. If these dividends are high, the EPS available for common shareholders goes down.
Stock Splits and Buybacks: When a company does a stock split, the total number of shares goes up, which usually lowers EPS. Buybacks do the opposite by reducing share count, often leading to a higher EPS.
New Share Issuance: If a company issues new shares to raise funds, the larger share base can dilute EPS unless profits grow at the same pace.
Accounting Adjustments and One-Time Items: Special situations like selling an asset, restructuring, or unusual gains and losses can temporarily impact net profit and change EPS for that period.
After considering what affects EPS, it’s equally important to examine the boundaries of its usefulness.
Limitations of EPS as a Metric
While earnings per share are a widely used measure of profitability, it has certain drawbacks you should keep in mind. Here are some of the key limitations:
Possibility of Manipulation
Companies can make their EPS look better by adjusting accounting practices, like speeding up revenue recognition, delaying expenses, or using loopholes. Because of this, the reported EPS may not always reflect the company’s true financial condition.
Doesn’t Show Earnings Quality
EPS only tells you how much profit is earned per share, but not how that profit was generated. At times, profits may come from one-time activities such as selling an asset or making accounting adjustments, instead of the company’s main business operations.
Ignores Future Share Dilution
Basic EPS is usually calculated with the current number of shares. If a company issues more shares in the future, for example, through employee stock options or convertible bonds, the EPS will decline, even if profits stay the same.
Effect of Share Buybacks
When companies buy back their own shares, the total number of shares decreases, which pushes EPS higher. This increase doesn’t always mean the company has improved its performance; it could just be a result of fewer shares being available.
No Adjustment for Inflation
EPS doesn’t factor in inflation. Over time, part of the growth in EPS might simply be due to rising prices rather than actual business improvement.
Limited Use Across Industries
EPS isn’t always suitable for comparing companies in different industries. For example, the EPS of an IT company and a utility company may differ greatly because their business models and capital needs are not the same.
Conclusion
By now, you’ve seen how EPS works, why it matters in the stock market, and where its limitations lie. EPS gives you a clear snapshot of a company’s profitability per share and helps in comparing performance across businesses. Still, it’s only one part of the bigger financial picture and should always be considered along with other metrics for better judgment.
For a more complete view, platforms like Precize can add real value. Precize gives you access to alternative investments in private equity and private credit while also providing detailed research reports. From balance sheets and cash flow statements to industry and peer analyses, you get the kind of information that makes decision-making clearer.
Reserve your access with Precize!
FAQs
What does EPS show an investor?
EPS gives you an idea of how profitable a company is. It’s also used in the P/E ratio, which shows how much investors are paying for each rupee of earnings.
Does a higher EPS always mean a stronger company?
Not necessarily. A higher EPS looks good, but it should be compared with companies in the same industry or with the company’s past performance. Sometimes, even with rising EPS, stock prices may not increase if market expectations are higher.
What is Trailing Twelve Month (TTM) EPS?
TTM EPS is the earnings per share calculated using the last 12 months of reported results. It gives you a more updated view of a company’s profitability.
Can EPS be adjusted or influenced?
Yes, EPS can be affected by accounting methods or company decisions. That’s why it’s better to look at it along with other financial indicators for a clearer picture.
Why does EPS matter to shareholders?
EPS shows the portion of profit linked to each share you own. It reflects the income that is available for shareholders.
What are preferred dividends, and why are they deducted from the EPS calculation?
Preferred dividends are payments given to preferred shareholders before common shareholders. Since EPS is meant for common shareholders, these dividends are subtracted from net profit during the calculation.
Disclaimer
The information provided in this article is for educational purposes only. It should not be considered financial or investment advice. Stock market investments and alternative assets involve risks, and readers are encouraged to do their own research or consult with a qualified financial advisor before making any decisions.

Stay in the Loop
Join our newsletter for exclusive access to thoughtfully curated content and we promise, no spam


Company
Our Office
Office No. 1219, The Summit Business Park, Andheri Kurla Road, Andheri East, Mumbai, Maharashtra - 400093
Find us on Googlesupport@precize.in
+91 7738336457
All trademarks and logos or registered trademarks and logos found on this Site or mentioned herein belong to their respective owners and are solely used for informational and educational purposes.
The material presented in this advertisement is for informational purposes only and should not be construed as investment advice or investment availability. It is not a recommendation of, or an offer to sell or solicitation of an offer to buy, any particular unlisted share, security, strategy, or investment product. Investing in the private market and securities involves risks, including the potential loss of money, and past performance does not guarantee future results. Market trends, data interpretations, graph projections are provided for informational and illustrative purposes and may not reflect actual future performance. Nothing on this website should be construed as personalized investment advice or should not be treated as legal, financial, or any other form of advice. Precize is not liable for financial or any other form of loss incurred by the user or any affiliated party based on information provided herein.
Precize is neither a stock exchange nor does it intend to get recognized as a stock exchange under the Securities Contracts Regulation Act, 1956. Precize is not authorized by the capital markets regulator to solicit investments. The securities traded on these platforms are not traded on any regulated exchange.
The website will be updated regularly.
Copyright © 2026 - Precize - All Rights Reserved