Revenue Crossing ₹1,000 Crore Shows Better Scale
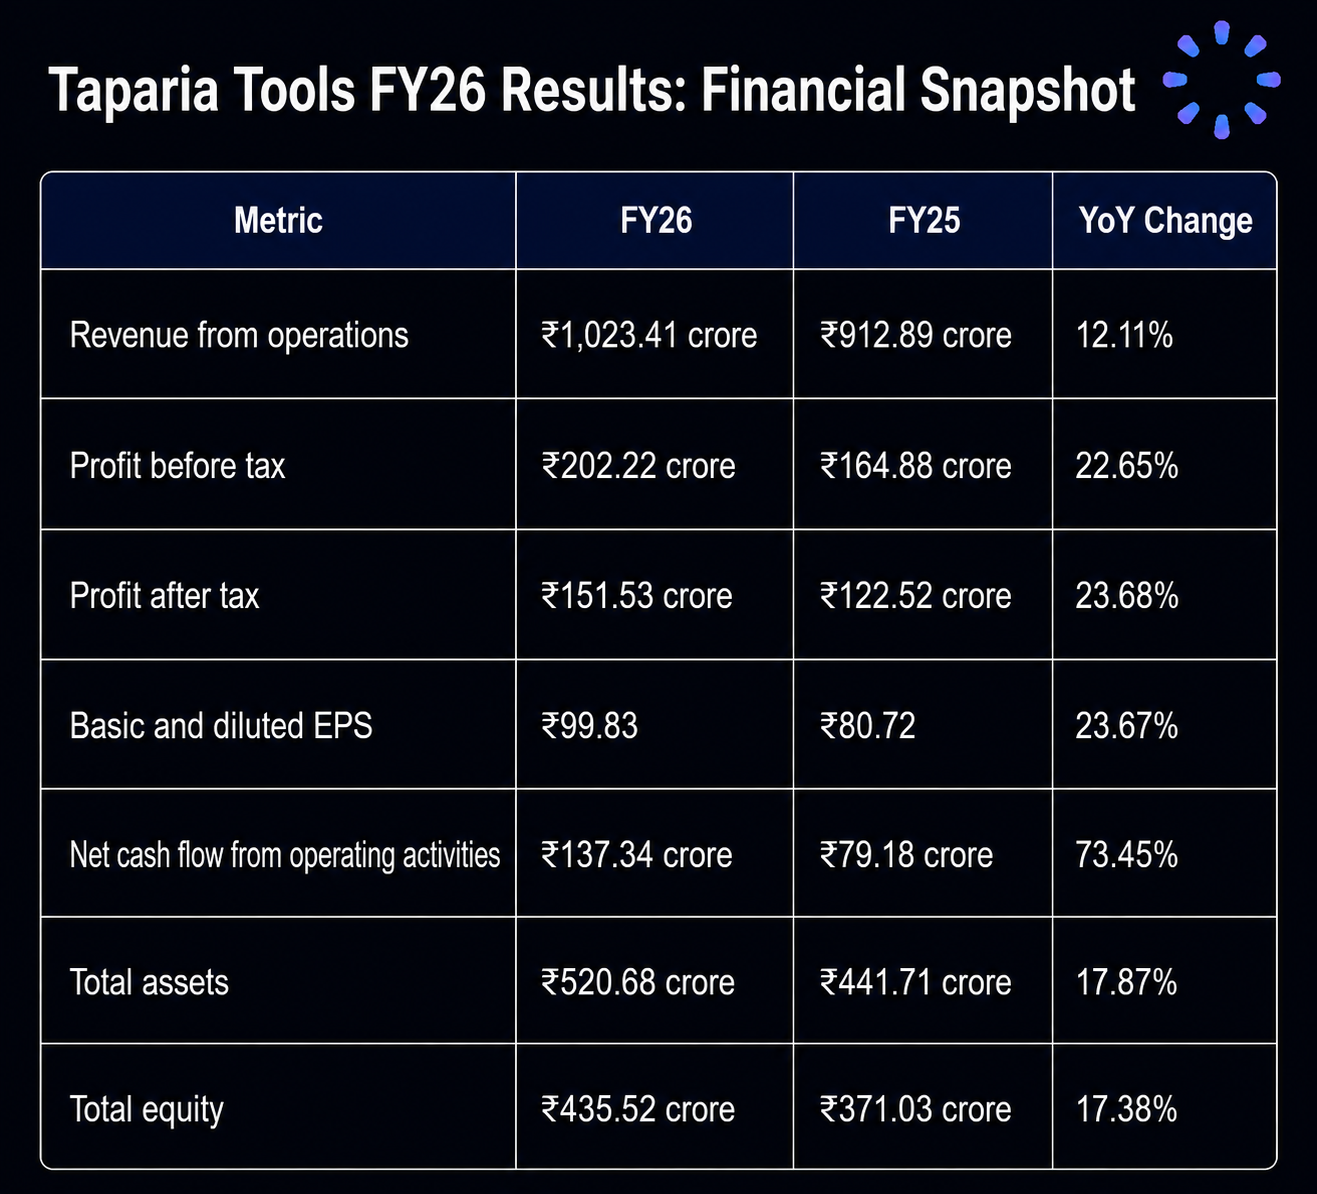
Taparia Tools revenue FY26 crossing ₹1,000 crore is an important scale milestone. Revenue from operations reached ₹1,023.41 crore, compared with ₹912.89 crore in FY25.
For a hand tools company, scale can support the business in several ways:
Wider distribution reach: Larger revenue can indicate deeper channel access and better dealer relationships.
Better manufacturing absorption: Higher volumes can spread fixed costs across more units.
Stronger brand recall: In tools, customers often repeat purchases when quality and availability are consistent.
Improved supplier leverage: Larger purchasing volumes can help with input procurement, though this depends on market conditions.
The company remains focused on its core hand tools segment. That makes the growth story easier to understand, but it also means investors should watch the demand cycle for industrial, workshop, repair, and construction-linked tools.
For more market explainers and company analysis, readers can also browse the Precize blog.
Taparia Tools operating cash flow improved sharply in FY26. Net cash flow from operating activities rose to ₹137.34 crore from ₹79.18 crore in FY25.
That is a 73.45% increase, which is much faster than both revenue growth and profit growth.
This matters because cash flow tests the quality of reported earnings. If profits rise but operating cash flow does not follow, investors need to look deeper into working capital, receivables, inventory, and one-off items. In FY26, Taparia Tools showed stronger cash generation alongside higher profits.
The cash flow result also supports the dividend story. A high dividend is more comfortable when it is backed by cash generation, not only accounting profit.
Still, investors should compare operating cash flow with capital expenditure and dividend payments over time. A single year of strong cash flow is positive, but dividend sustainability depends on repeatable free cash flow across cycles.
Balance Sheet Strength: Assets and Equity
Taparia Tools ended FY26 with total assets of ₹520.68 crore and total equity of ₹435.52 crore.
That equity base suggests a strong net worth and a relatively stable capital structure. Total equity represented about 83.6% of total assets, which points to a balance sheet with meaningful shareholder funding.
For investors, a strong balance sheet can help in three ways:
It gives the company more room to handle demand slowdowns.
It can support dividends without stretching the balance sheet.
It may allow reinvestment in capacity, distribution, or working capital when needed.
Balance sheet strength does not remove business risk. But in a cyclical manufacturing segment, a healthy equity base can give management more flexibility.
The board recommended a final dividend of ₹35 per equity share for FY26. With a face value of ₹10 per share, this equals 350% of face value.
The dividend is a clear shareholder-return signal. Based on FY26 EPS of ₹99.83, the proposed final dividend is about 35.1% of earnings per share.
That payout level looks meaningful, but not extreme, when viewed against the year's profit and operating cash flow. It suggests the company is returning capital to shareholders while still retaining earnings in the business.
For investors, the dividend has two sides.
On the positive side, it indicates:
Cash confidence: The board appears comfortable with the company's cash position.
Shareholder focus: Management is sharing profits through direct payouts.
Business maturity: Strong dividend payouts often come from companies with stable cash generation.
The caution is reinvestment. If Taparia Tools sees large growth opportunities, investors should check whether dividend payouts leave enough capital for capacity expansion, product development, working capital, and distribution growth.
The right question is not simply, "Is the dividend high?" The better question is, "Can Taparia Tools keep paying dividends while still investing enough for future growth?"
Governance and Audit Quality
The statutory auditors, Batliboi & Purohit, issued an unmodified opinion on the FY26 financial statements. In plain terms, the auditors did not flag a qualification in their opinion on whether the financial statements present a true and fair view.
For investors, this is a useful trust signal. It does not mean the company is risk-free, and it is not a substitute for due diligence. But a clean audit opinion supports confidence in the reported financials.
The company also accounted for the incremental impact of the new Indian Labour Codes on retiral benefits. This shows proactive accounting for regulatory changes that can affect employee benefit liabilities.
For financial content that discusses unlisted shares, governance matters as much as growth. Investors should look at audit quality, disclosures, related-party transactions, working capital, dividend policy, and liquidity before making decisions. You can review common investor questions on the Precize FAQs.
Risks Investors Should Watch After FY26
Taparia Tools FY26 Results are strong, but investors should still review the risks that come with manufacturing and less-liquid investment opportunities.
1. Margin Sustainability
Profit grew faster than revenue in FY26. That is positive, but the next question is whether margins can stay at these levels.
Input costs, wage costs, freight, power, and competitive pricing can all affect profitability. If costs rise faster than selling prices, margins could narrow.
2. Demand Cyclicality
Hand tools demand is linked to industrial activity, repair markets, construction, workshops, and manufacturing. A slowdown in these areas could affect revenue growth.
Taparia Tools has the advantage of a focused product category, but that focus also means investors should track the health of the broader tools and industrial supplies market.
3. Dividend Sustainability
The ₹35 dividend is attractive, but dividends should be judged over multiple years. Investors should compare dividends with profit, operating cash flow, and capital expenditure.
If earnings slow or the company needs more money for expansion, future payouts could change.
4. Liquidity and Valuation
Financial performance is only one part of the investment decision. Investors should also check share liquidity, available pricing, valuation multiples, and exit options.
This is especially important for unlisted or thinly traded opportunities. A good business can still be a difficult investment if the entry price is too high or liquidity is limited. Investors can also review how unlisted shares differ from listed shares when assessing liquidity and price discovery.
Analyst View: What Matters Most Now
Taparia Tools looks like a mature, cash-generative manufacturing company that delivered a strong FY26. The best part of the result was not just crossing ₹1,000 crore in revenue. It was the combination of revenue growth, faster PAT growth, better operating cash flow, and a healthy equity base.
From an analyst's perspective, the next phase depends on five questions:
Can revenue keep growing from a higher base? Crossing ₹1,000 crore is impressive, but it makes future growth comparisons tougher.
Can margins hold? PAT growth outpaced revenue growth in FY26, but investors should test whether this continues.
Can operating cash flow remain strong? Cash generation is key to dividend sustainability and business resilience.
Will dividends stay balanced with reinvestment? A high payout is positive only if the business still has enough capital to grow.
Is the valuation reasonable? Strong results do not automatically make a share attractive at any price.
Investors evaluating private market opportunities should compare financial data, liquidity, and valuation before making a decision.
Taparia Tools FY26 Results are positive, but they should be treated as a starting point for analysis, not a standalone buy signal.
The company has clear strengths: double-digit revenue growth, faster profit growth, strong operating cash flow, a clean audit opinion, and a shareholder-friendly dividend. These are attractive signals for investors who prefer mature, profitable businesses over early-stage growth stories.
At the same time, investors should avoid looking only at the dividend. A ₹35 payout is meaningful, but the investment case should also include valuation, liquidity, future growth, margin risk, and the company's capital allocation priorities.
If you are studying Taparia Tools, build your checklist around:
FY26 and FY25 revenue, PBT, PAT, and EPS.
Operating cash flow and working capital movement.
Dividend history and payout ratio.
Balance sheet strength and capital expenditure needs.
Liquidity and available transaction prices.
Risks from input costs and industrial demand cycles.
If you need help understanding unlisted share processes or platform support, you can contact Precize Care.
Taparia Tools FY26 Results show a business with scale, profitability, cash generation, and a clear shareholder payout policy.
Revenue crossing ₹1,000 crore is the visible milestone. But the deeper signal is that PAT grew faster than revenue and operating cash flow improved sharply. That combination makes the FY26 result stronger than a simple sales-growth story.
Investors should remain balanced. Taparia Tools looks financially strong based on the supplied FY26 numbers, but future returns will depend on valuation, liquidity, margin sustainability, dividend consistency, and broader industrial demand.
For long-term investors, the key question after FY26 is not only whether Taparia Tools can keep growing revenue. The better question is whether it can keep converting that growth into profit, cash flow, and sustainable shareholder returns.
FAQs
1. What Was Taparia Tools Revenue FY26?
Taparia Tools revenue from operations was ₹1,023.41 crore in FY26, compared with ₹912.89 crore in FY25. That represents year-on-year growth of 12.11%.
2. How Much Did Taparia Tools PAT Grow in FY26?
Taparia Tools profit after tax grew 23.68% in FY26 to ₹151.53 crore, compared with ₹122.52 crore in FY25. PAT growth was much faster than revenue growth, which points to better profitability.
3. What Dividend Did Taparia Tools Announce for FY26?
Taparia Tools recommended a final dividend of ₹35 per share for FY26, subject to shareholder approval. This equals 350% of the ₹10 face value per share.
4. How Strong Was Taparia Tools Operating Cash Flow?
Taparia Tools generated ₹137.34 crore in net cash flow from operating activities in FY26, compared with ₹79.18 crore in FY25. This 73.45% increase supports the quality of earnings and the dividend discussion.
Stay updated with Taparia Tools and other unlisted companies through our Precize Community. If this article was useful, you can share it with other investors through the Precize Referral Program.
Disclaimer: This content is for informational purposes only and does not constitute investment advice. Investing in unlisted shares involves risks including illiquidity and potential loss of capital. Consult a qualified financial advisor before making investment decisions. Precize is not a stock exchange and is not regulated by SEBI. This is not a recommendation to buy or sell shares of Taparia Tools. Do your own research before investing. Past performance does not guarantee future results. Returns on unlisted shares are not guaranteed.