Indian Market Indices Live Watch

Tracking the pulse of the stock market in real time is critical for making informed financial decisions. Whether you’re an active investor or a market enthusiast, staying updated on market movements can help you understand broader economic trends and market sentiment. The NSE (National Stock Exchange of India) provides accurate, live data on market indices, offering a clear window into how different sectors and stocks are performing throughout the day.
In this blog, you’ll learn what the NSE is, the key Indian market indices to track, and how to monitor them live. We’ll also cover key factors driving index movements, how NSE live data works, practical tracking tips, common mistakes to avoid, and advanced tools for deeper market analysis.
Let’s get into it!
Overview
NSE and Key Indices: Nifty 50, Sensex, Nifty Bank, IT, Pharma, Midcap, and sectoral indices are essential for tracking Indian market movements.
Live Monitoring: Use trusted platforms, official exchange sites, charts, watchlists, heatmaps, and news tickers for real-time updates.
Influencing Factors: Economic indicators, corporate results, government policies, global events, sector trends, currency, politics, and market sentiment affect index movements.
Advanced Tools: Live dashboards, technical charts, index movers, custom alerts, sentiment analysis, bulk transaction data, and historical analytics help track and understand trends.
What is NSE?
The NSE stands as one of India’s top stock exchanges and serves as a key pillar in the country’s financial market. Established in 1992, the NSE provides a fully electronic trading platform that allows smooth and fast trading of stocks, bonds, derivatives, and other financial instruments. It helps companies and traders in India to buy and sell shares transparently and efficiently. The NSE is well-known for providing real-time market data, including stock prices, indices, and other important financial information.
Now that you understand what the NSE is, it’s important to look at the key Indian market indices you should track to get a clear picture of market movements.
Key Indian Market Indices You Must Track
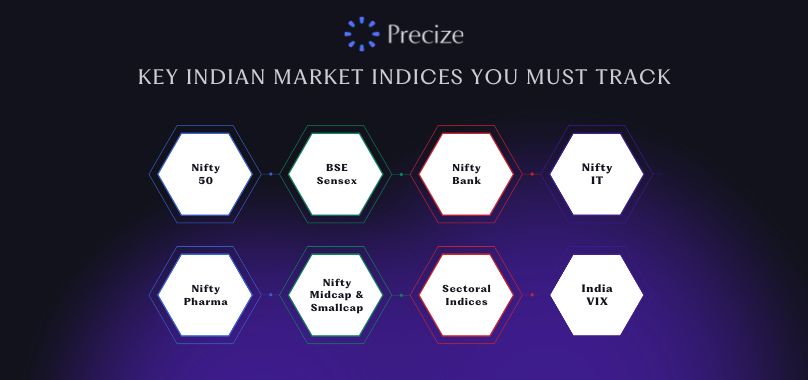
When you check Indian market indices live, it’s important to focus on key benchmarks that reflect how the market and different sectors are performing during the trading day. Here are the main indices you should keep an eye on:
Nifty 50
This is one of the most important indices on the NSE. It tracks 50 major companies across various sectors, giving you a clear view of the overall market movement during trading hours.
BSE Sensex
The Sensex tracks the performance of 30 large, well-established companies listed on the BSE. It acts as a key indicator of how blue-chip stocks are performing in real time.
Nifty Bank
If you want to monitor the banking sector, Nifty Bank focuses on major banks and provides live updates on how financial stocks are moving throughout the day.
Nifty IT
This index shows real-time data on information technology companies listed on the NSE, helping you track the tech sector’s performance.
Nifty Pharma
To follow the pharmaceutical sector, Nifty Pharma offers live updates on how pharma stocks are doing in the market.
Nifty Midcap and Smallcap
These indices track medium and small-sized companies, giving you insight into the performance of businesses beyond the large-cap segment.
Sectoral Indices (FMCG, Auto, Metal, Energy)
You can also track specific sectors like FMCG, automobile, metal, and energy. These sector indices show live trends and movements, helping you see how individual industries are performing.
India VIX
Known as the volatility index, India VIX shows the level of market uncertainty or stability, updating live alongside other indices to help you understand market sentiment.
With these major indices in mind, let’s explore how you can keep an eye on them live and stay updated on market trends.
How to Monitor Indian Market Indices Live?
If you want to keep track of how the Indian stock market is moving during the day, there are simple and easy ways to stay updated, no matter how busy your schedule is. Here’s how you can do it:
Check Reliable Financial Websites
Websites like NSE India and Economic Times offer real-time updates on important indices like Nifty 50, Sensex, and sector-specific ones. These sites are easy to use and give you the latest numbers at a glance.
Visit Official Exchange Websites
For the most accurate and official data, you can visit the NSE and BSE websites. They show live updates on daily high and low points, percentage changes, and how major indices are moving throughout the trading day.
Use Charts and Visual Tools
If you prefer seeing data visually, platforms like NSE Indices provide easy-to-read candlestick charts, line charts, and comparison tools. These help you spot market trends quickly without having to analyze numbers manually.
Create Watchlists on Apps
Most financial apps let you set up watchlists where you can add Nifty, Sensex, Bank Nifty, and others. Once set up, you’ll get live notifications, so you don’t have to keep checking the numbers constantly.
Look for Lists and Heatmaps
Business websites usually provide lists or heatmaps that highlight the most active sectors or indices at any moment. This helps you quickly see major market movements without having to track every individual stock.
Follow Live News Tickers
Many financial news sites have live tickers that constantly update market movements and highlight important events. This keeps you informed about daily changes and any big announcements that could affect the indices.
Watching the numbers is useful, but understanding the reasons behind their movements helps make sense of the market trends.
Factors Affecting Indian Market Indices
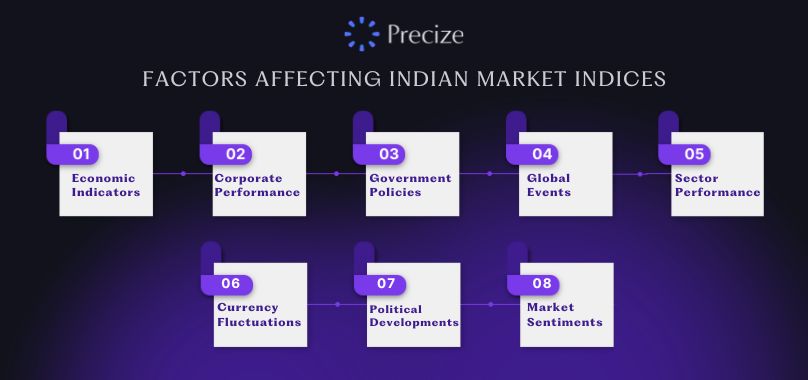
When you track Indian market indices, it’s important to understand what drives their daily movements. Here are the main factors that influence how these indices change:
Economic Indicators
Numbers like GDP growth, inflation, and unemployment show the overall health of India’s economy. If these indicators show positive or negative changes, the market indices usually react quickly.
Corporate Performance
The results and announcements of big companies listed on the stock exchanges affect the indices. When a major company reports strong quarterly results or makes a big business deal, the market tends to go up. On the other hand, weak results can pull the indices down.
Government Policies
Changes in government rules, tax announcements, budget speeches, or new reforms can influence market sentiment. Important policy decisions often cause the indices to move significantly.
Global Events
What happens in the world also affects Indian indices. Changes in global oil prices, decisions by the US Federal Reserve, or trends in major foreign markets can impact the Indian market in real time.
Sector Performance
Certain indices focus on specific industries like IT, banking, pharma, and automobiles. When one sector performs well, its index rises, giving you a quick idea of that industry’s current situation.
Currency Fluctuations
The Indian Rupee’s value compared to the US Dollar plays a role in market movements, especially for companies involved in export or import. If the rupee weakens or strengthens significantly, it can impact how companies perform and influence the indices.
Political Developments
Events like elections, changes in leadership, or government stability are closely watched. Political uncertainty or major announcements often create market volatility.
Market Sentiments
Day-to-day news, social media chatter, and rumors can affect how people feel about the market. Times of uncertainty, such as before important government decisions, often lead to sharp index movements.
Understanding the factors that influence market indices helps you make sense of the live data provided by the NSE.
How NSE Live Data Works
When you want to keep track of the Indian stock market in real time, understanding how NSE live data works is key to seeing the latest market movements as they happen.
Level 1 Data
This shows the best available buy and sell prices (called best bid and best ask) along with the total quantity available at those prices. It gives you a quick view of the top market activity in real time.
Level 2 Data
If you want more detail, Level 2 shows the market depth up to the 5 best price levels on both the buy & sell sides. This helps you understand the supply and demand beyond just the top prices.
Level 3 Data
For even deeper insight, Level 3 displays up to 20 best bid and ask prices. This gives you a clearer picture of how orders are placed and how the order flow works in the market.
Knowing the mechanics of NSE live data is useful, but tracking indices accurately also means steering clear of common mistakes.
Common Mistakes to Avoid While Tracking Market Indices
When you track Indian market indices like NSE Nifty 50 or Sensex live, it is easy to make mistakes that can lead to misunderstanding market movements. Here are some common errors you should avoid:
Relying on Delayed Data
Market indices change constantly during trading hours. Do not depend on end-of-day data or delayed updates, as they do not reflect the real market situation at that moment.
Ignoring Index Composition
Each index consists of specific stocks with different weightings. Understanding which companies are part of the index and their relative weight helps you interpret why the index moves in a particular way.
Confusing Price Movement with Actual Value
A rise or fall in index points does not always reflect the true value change of all stocks in the index. This happens because of differences in stock weight and individual company performance.
Using Unreliable Sources
Make sure you follow official sources such as the NSE and BSE websites or trusted financial news platforms to get accurate and updated information about index movements.
Overlooking Sector Influence
Indices often move based on the performance of major sectors such as banking or IT. Do not ignore how these sectors can significantly impact the overall index direction.
Focusing Only on Daily Highs and Lows
While daily highs and lows are useful, observing only these numbers without understanding the bigger picture can provide a misleading view of the market trend.
Mixing Up Point Change and Percentage Change
Always check both the absolute point change and the percentage change of an index. This helps you better understand the scale of the market movement.
Neglecting Global and Economic News
Market indices are affected by economic reports, global events, and government policy changes. Ignoring these external factors gives you an incomplete picture of what is driving the market.
Overreacting to Volatility
Short-term swings are normal in the market. Do not react strongly to every small movement unless it is part of a clear and sustained trend.
Watching Only One Index
Do not focus solely on the Nifty 50 or Sensex. Tracking multiple indices, including sector-specific ones, helps you get a complete view of market trends and sector health.
With common mistakes out of the way, it’s easier to explore advanced tools that provide deeper insights into market trends.
Advanced Tools for Market Indices Analysis
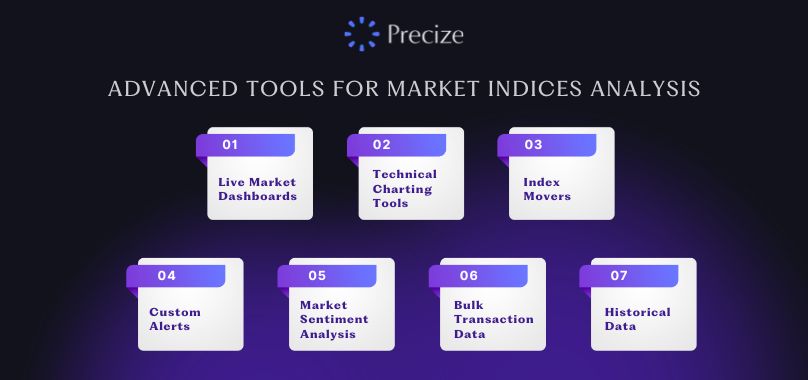
To get a clearer and more detailed view of Indian market indices like Nifty 50 and Sensex, using advanced tools can help you analyze real-time market movements more effectively.
Live Market Dashboards
These dashboards show real-time updates of major indices, including the latest prices, daily highs and lows, and percentage changes. They provide a quick and clear view of how the market is moving throughout the day.
Technical Charting Tools
Advanced charting tools allow you to view market trends and patterns using indicators such as the RSI (Relative Strength Index) and Moving Averages, MACD (Moving Average Convergence Divergence). These help you spot trends and understand momentum changes in the market.
Index Movers and Sector Performance
This tool shows which stocks or sectors are leading the market at any moment. It highlights the biggest gainers and losers in the indices, giving you a better understanding of market shifts.
Custom Alerts and Notifications
You can set up alerts for specific index levels or other important metrics. This way, you get notified instantly when there is significant market movement, without having to constantly monitor the market.
Market Sentiment Analysis
Some platforms offer sentiment analysis that shows the overall market mood, whether it is bullish or bearish, based on current market data. This gives you a quick sense of how traders are feeling.
Bulk Transaction Data
You can track large buy or sell transactions made by major market players. This gives you clues about significant activity happening in the market at any given time.
Historical Data and Analytics
Access to historical data allows you to compare the current performance of indices with past trends. This helps you see how the market has behaved over time and spot important patterns.
Conclusion
Tracking Indian market indices, such as Nifty 50 and Sensex, gives you a clear view of how different sectors and the overall market are performing throughout the day. By understanding key indices, monitoring real-time data, and using advanced tools like live dashboards, technical charts, and sentiment analysis, you can follow market movements more effectively and make sense of daily trends.
Additionally, platforms like Precize that facilitate investments in private companies, allowing you to buy and sell unlisted shares and pre-IPO shares, or provide global finance opportunities for alternative fixed-income options, can add further insight and opportunities to your market watch.
Reserve access today for a more diversified portfolio and stay ahead in understanding market movements.
FAQs
How Often Do Market Indices Update?
Market indices update continuously during market hours, showing the latest stock prices as they change throughout the day. The closing value of an index is typically calculated as a weighted average of prices recorded during the last 30 minutes of trading.
Are Market Indices Easily Manipulated?
The NSE, for example, has strong surveillance systems in place to prevent manipulation. With high liquidity and a large number of active traders, it becomes very difficult to manipulate index prices.
What Are Sectoral Indices?
Sectoral indices track the performance of specific industries like banking, IT, pharma, FMCG, infrastructure, and others. They help you understand how different parts of the economy are performing at any given time.
How Can You Interpret Index Movements?
When the index value goes up, it means that most of the stocks included in that index are rising in price. If the index falls, it indicates that many stocks are losing value. This gives you a quick overview of the overall market’s condition.
Disclaimer
This blog is intended to provide a clear understanding of Indian market indices and how to monitor them. The content is based on publicly available information and general market observations, and it may not reflect the most current data at all times. The insights shared are for informational purposes only and should not be treated as professional guidance or advice. Readers should confirm all information through official sources such as NSE, BSE, or trusted financial platforms before making any decisions based on this information. The blog aims to help you stay informed and aware of market movements, not to influence financial actions.

Stay in the Loop
Join our newsletter for exclusive access to thoughtfully curated content and we promise, no spam


Company
Our Office
Office No. 1219, The Summit Business Park, Andheri Kurla Road, Andheri East, Mumbai, Maharashtra - 400093
Find us on Googlesupport@precize.in
+91 7738336457
All trademarks and logos or registered trademarks and logos found on this Site or mentioned herein belong to their respective owners and are solely used for informational and educational purposes.
The material presented in this advertisement is for informational purposes only and should not be construed as investment advice or investment availability. It is not a recommendation of, or an offer to sell or solicitation of an offer to buy, any particular unlisted share, security, strategy, or investment product. Investing in the private market and securities involves risks, including the potential loss of money, and past performance does not guarantee future results. Market trends, data interpretations, graph projections are provided for informational and illustrative purposes and may not reflect actual future performance. Nothing on this website should be construed as personalized investment advice or should not be treated as legal, financial, or any other form of advice. Precize is not liable for financial or any other form of loss incurred by the user or any affiliated party based on information provided herein.
Precize is neither a stock exchange nor does it intend to get recognized as a stock exchange under the Securities Contracts Regulation Act, 1956. Precize is not authorized by the capital markets regulator to solicit investments. The securities traded on these platforms are not traded on any regulated exchange.
The website will be updated regularly.
Copyright © 2026 - Precize - All Rights Reserved