
SBI Funds Management FY26 Results show a strong operating year: Revenue rose 22.01% to ₹4,389 crore, profit after tax (PAT) reached ₹3,067 crore, and average assets under management (AUM) climbed to ₹12.15 lakh crore. For investors tracking the upcoming IPO, these numbers matter because they show scale, profitability, and recurring fee strength before listing.
SBI Funds Management FY26 Financial Performance at a Glance
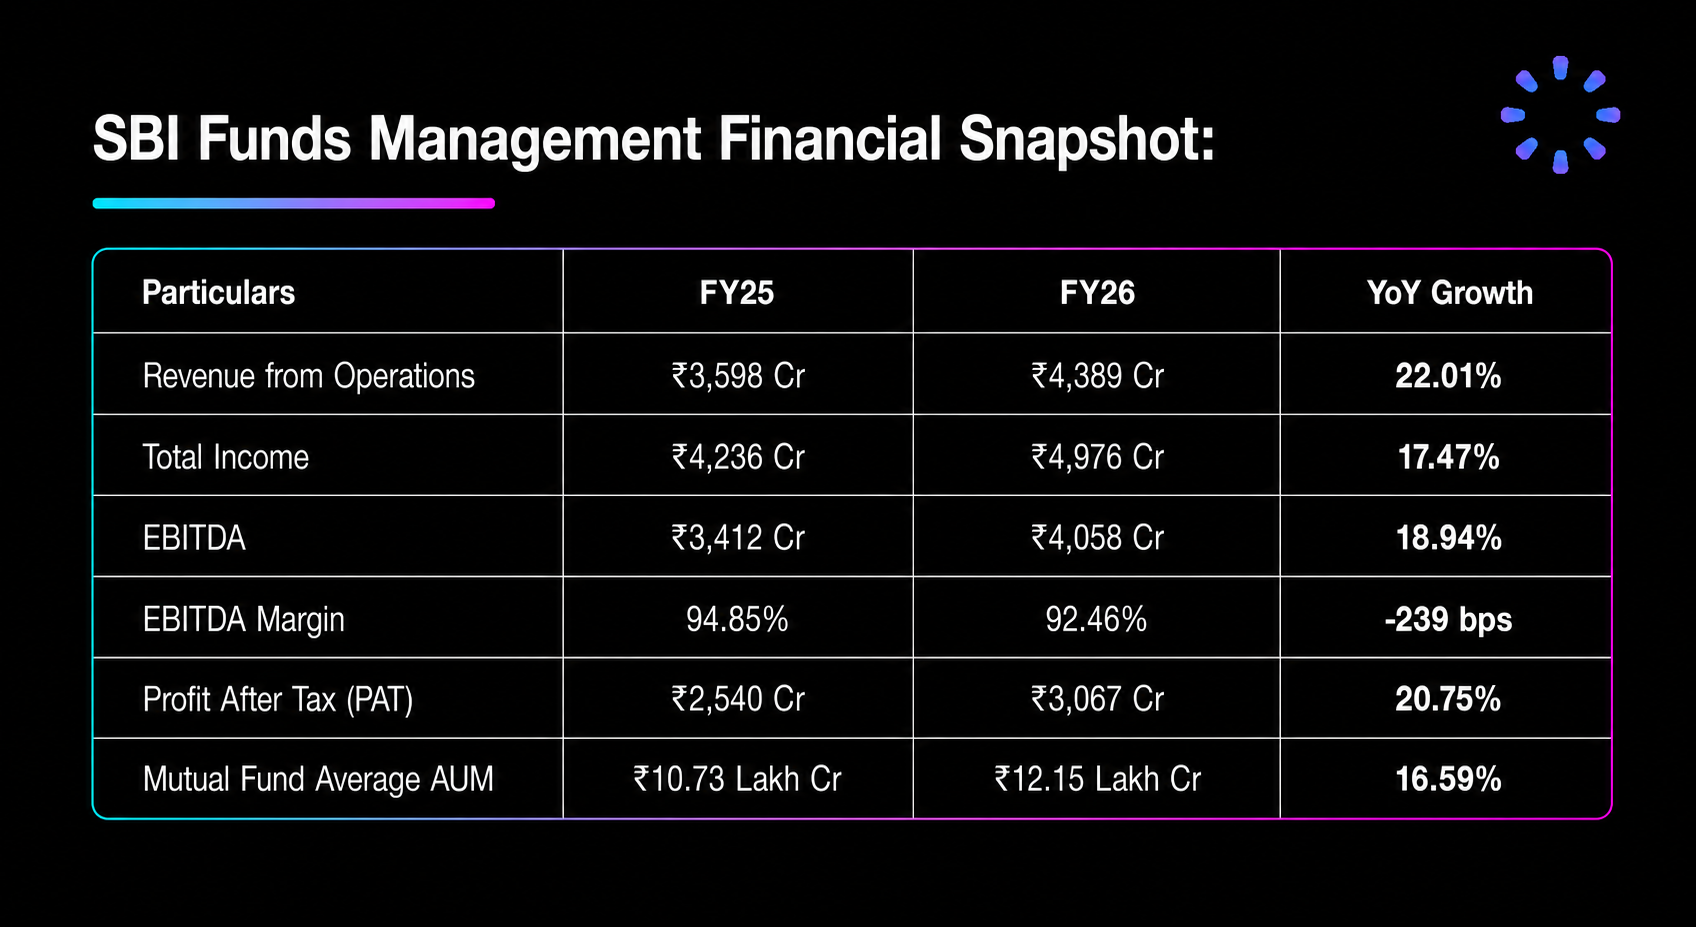
With the company preparing for its proposed IPO, these financial metrics become even more relevant for investors evaluating the business. Consistent earnings growth, expanding AUM, and improving investor participation reinforce the investment case, but understanding the key drivers behind these numbers is equally important.
Why Revenue Growth in SBI Funds Management FY26 Results Matters
Revenue from operations rose from ₹3,598 crore to ₹4,389 crore. That is not just a one-quarter spike. It reflects a structural feature of the AMC model: fee income scales with assets under management.
For a large fund house, this creates a powerful growth loop:
Higher investor participation drives net inflows.
Net inflows and market gains raise AUM.
Rising AUM supports higher recurring fee revenue.
Operating leverage protects margins even during expansion.
This is why investors often track AUM quality and net flows as closely as they track revenue.
Profitability Remains a Core Strength
SBI Funds Management remains among the most profitable financial businesses in India by margin profile.
FY26 margin snapshot:
EBITDA Margin: 92.46%
EBIT Margin: 91.46%
PBT Margin: 91.25%
PAT Margin: 69.88%
PAT crossed ₹3,067 crore despite ongoing spend on technology, digital onboarding, and distribution. Margins softened slightly year-on-year, but they remain exceptionally high for the sector and still support a strong earnings narrative ahead of IPO.
AUM Scale and Market Leadership in SBI Funds Management FY26 Results
AUM is the key driver for any AMC because fees are linked to assets managed. In FY26, SBI Funds Management continued to expand at scale.
AUM highlights:
Mutual Fund Average AUM: ₹12.15 lakh crore
Total Business QAAUM: ₹29.46 lakh crore
Individual Investor AUM: ₹5.82 lakh crore
Passive AUM: ₹4.06 lakh crore
Passive Market Share: 27.9%
Crossing ₹12 lakh crore in average mutual fund AUM is a major milestone. It signals both distribution depth and sustained investor trust.
Retail Participation Is Expanding Faster
The retail trend in Indian mutual funds stayed strong in FY26, and SBI Funds Management captured that momentum.
The company:
Added 53 lakh new investors.
Increased unique investors to 1.80 crore.
Processed over 17.27 million monthly SIP transactions.
Reported monthly SIP trigger value of ₹40.59 billion.
For IPO investors, this matters because a broad retail base can improve flow stability across market cycles.
Digital and Passive Businesses Are Becoming Bigger Earnings Drivers
SBI Funds Management continued to invest in digital infrastructure, including InvesTap Nxt features such as AI-led assistance, conversational interfaces, portfolio analytics, and account aggregator integration.
At the same time, passive products are becoming a larger part of the growth story:
Passive AUM at ₹4.06 lakh crore
Passive market share at 27.9%
As ETF and index adoption rises, passive assets can support scale with efficient operating cost structures.
Balance Sheet and Return Ratios
Financial quality remains strong:
Debt-to-Equity: 0.00x
Return on Equity (ROE): 43.01%
Return on Assets (ROA): 40.38%
Book Value: ₹29.23 per share
A debt-free balance sheet with high return ratios usually indicates a high-quality, cash-generative business model.
What the DRHP Filing Signals After SBI Funds Management FY26 Results
The DRHP filing is a major milestone, but it is still an early stage in the listing process. Investors should treat it as the beginning of deeper diligence, not the final valuation signal.
If the IPO is primarily OFS-led (offer for sale), the proceeds mainly go to selling shareholders rather than to fresh expansion capital. That does not make the issue weak. It simply changes how investors should interpret capital allocation and post-listing growth assumptions.
If you are new to this process, this quick guide to common pre-IPO process questions helps before you evaluate allocation decisions.
For updates, track official filings and observations on SEBI and monitor market-wide fund flow data from AMFI.
Key Risks Investors Should Monitor
Even strong AMCs are market-linked businesses. Key risks include:
Market correction risk: Equity declines can pressure AUM and fee income.
Regulatory risk: TER or distribution rule changes can impact profitability.
Competition risk: Listed peers continue to compete on products, performance, and distribution.
Fee compression risk: Passive migration may pressure blended yield over time.
Cycle risk: Sustained capital market weakness can reduce net inflows.
A balanced IPO view should weigh both business quality and valuation discipline.
SBI Funds Management FY26 Results vs Listed AMC Benchmarks
Investors usually compare an upcoming AMC IPO against listed peers such as HDFC AMC, Nippon Life AMC, and UTI AMC across:
Revenue growth consistency
PAT margin resilience
Equity versus debt versus passive mix
Cost-to-income efficiency
Valuation multiples at listing
This relative framework helps avoid decisions based only on brand familiarity or IPO headlines.
If you want to build a wider pre-IPO watchlist beyond AMCs, you can use the Precize screener and track company updates through the Precize blog. For platform process questions, the Precize FAQs and Precize Care are useful starting points. Stay updated with unlisted companies through our Precize Community. If this article was useful, you can share it with other investors through the Precize Referral Program.
Bottom Line
SBI Funds Management FY26 Results reinforce a clear investment narrative: scale, high profitability, strong investor acquisition, and category leadership ahead of IPO.
At the same time, disciplined investors should separate business strength from listing valuation. A strong business can still be a weak bet at an excessive price.
The practical approach is simple:
Track final RHP details after DRHP stage.
Compare valuation with listed AMC peers.
Watch AUM mix, net flows, and margin trends post listing.
Size exposure based on portfolio risk, not IPO excitement.
Frequently Asked Questions (FAQs)
1. Is SBI Funds Management profitable?
Yes. SBI Funds Management reported ₹3,067 crore PAT in FY26 with a 69.88% PAT margin, placing it among the most profitable AMCs in India.
2. What is SBI Funds Management AUM in FY26?
The company reported ₹12.15 lakh crore average mutual fund AUM and ₹29.46 lakh crore total business QAAUM in FY26.
3. Has SBI Funds Management filed its DRHP?
Yes. SBI Funds Management has filed its DRHP with SEBI, which is a key step toward its proposed IPO.
4. What is expected in the SBI Funds Management IPO structure?
The issue is expected to include a significant Offer for Sale (OFS) component by existing shareholders, subject to final offer documents and regulatory process.
Disclaimer: This article is for informational purposes only and does not constitute investment advice. Investing in unlisted shares involves risks including illiquidity and potential loss of capital. Consult a qualified financial advisor before making investment decisions. Precize is not a stock exchange and is not regulated by SEBI.