Taparia Tools Share Price Analysis: Trends, Performance, and Future Outlook

Staying updated on a company's stock performance is crucial when tracking investments or understanding market trends. Taparia Tools, a well-known brand in India’s hand tools industry, has gained attention for its share price movements.
In this blog, we will analyze the Taparia Tools share price, whether listed or not, covering its historical trends, key factors affecting its valuation, technical analysis insights, and future outlook.
Whether you are monitoring the company for market insights or simply curious about its financial trends, this blog will help you understand the overall performance of Taparia Tools shares.
Keep scrolling!
What is Taparia Tools Share Price?

Understanding its current price and trends helps in assessing the company's performance and market sentiment. Here are the key pointers of the current situation:
Current Stock Price: As of February 6, 2025, Taparia Tools’ share price is ₹13.53 on the Bombay Stock Exchange (BSE), reflecting a 4.9% increase from the previous closing price of ₹11.15
Recent Price Trend: The stock has shown a consistent upward movement, with the day's high and low both standing at ₹13.53, indicating stability
52-Week Performance: Over the past year, Taparia Tools' stock has seen significant growth, with its 52-week (February 6, 2025) high reaching ₹13.53,compared to a low of ₹3.21 (February 27, 2024), highlighting a strong recovery and growth potential.
[Unlisted shares do not have a fixed price and can fluctuate each day based on market conditions and trading activity.]
Is Taparia Tools Listed or Unlisted?
Taparia Tools is listed on the Bombay Stock Exchange (BSE) under the scrip code 505685. However, its shares do not see active trading on the exchange. Despite this, Taparia Tools' shares can also be found in the unlisted market.
Investors can buy and sell these unlisted shares through platforms like Precize, which specializes in facilitating transactions for unlisted securities.
Now that you understand the current status of Taparia Tools shares, it’s time to see how it has moved in the past and what that tells us.
Historical Trends of Taparia Tools Unlisted Share Price
Analyzing the historical unlisted share price of Taparia Tools helps understand the company’s stock performance over time. Below is the table of the share price movements for 2023 and 2024:
2023 Share Price Trend
Explanation of 2023 Trend
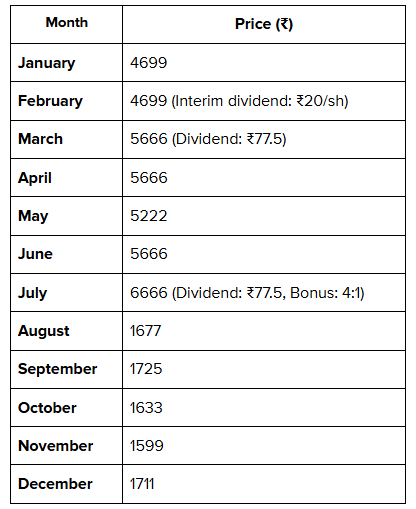
In 2023, Taparia Tools' share price witnessed substantial fluctuations.
January to July: The stock price started at ₹4699 in January and showed a rise in March and April, reaching ₹5666, influenced by dividends. In July, the price spiked to ₹6666, due to a combination of a dividend and a 4:1 bonus issue.
August to November: However, after July, the stock experienced a sharp decline, dropping to ₹1677 by August and further falling to ₹1599 by November.
December: The stock showed some recovery by December, closing at ₹1711.
(Source: Financial reports)
2024 Share Price Trend
Explanation of 2024 Trend
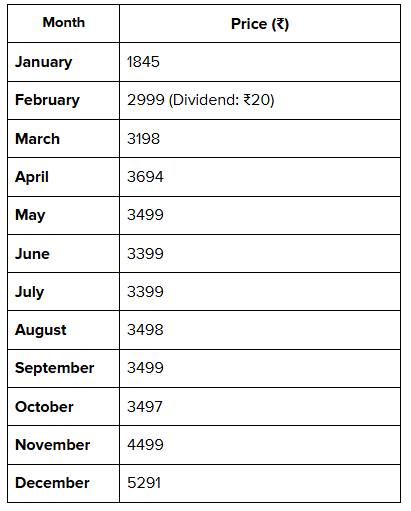
In 2024, the share price of Taparia Tools showed an overall upward trend.
January to April: The stock price began the year at ₹1845 and then saw gradual growth through the first quarter, reaching ₹3198 by March and ₹3694 by April. This growth was influenced by steady performance and investor confidence.
May to September: Although there were minor fluctuations, the stock price remained relatively stable between ₹3399 and ₹3499 from May through September.
October to December: A significant rise occurred towards the end of the year, with the price surging to ₹5291 by December, marking an overall strong recovery compared to 2023.
(Source: Financial reports)
With the historical trends in mind, let’s now shift focus to the various factors that directly impact Taparia Tools' share price.
Factors Influencing Taparia Tools Share Price
Taparia Tools, a trusted name in the hand tools industry since 1969, has manufacturing units in Nashik and Goa. Several influence the movement of Taparia Tools’ share price.
Company Performance: The company's financial health, including quarterly earnings, sales growth, and profitability, plays a key role. In FY24, Taparia Tools reported a total revenue from operation of approximately ₹764.49 Cr. (Source: Financial reports)
Market Conditions: Broader economic trends, government policies, and geopolitical factors can influence the stock price.
Cost and Competition: Increasing raw material costs and competition from domestic and global players can impact profitability and, in turn, the share price.
Investor Sentiment: Market perception and investor confidence impact the company’s market capitalization and share value.
Operational Efficiency: Profitability indicators such as operating margins affect how investors assess the company's financial strength.
Industry Trends: Growth in sectors like automobiles and the rising popularity of DIY tools contribute positively to demand and, in turn, the share price.
Financial Ratios: These metrics help evaluate the company’s valuation and performance. Taparia Tools' financial indicators include:
Current Market Price (CMP) (as of 05/02/25): ₹9999
Outstanding Shares: 15,178,750
Market Capitalization: ₹15,177.23 Cr
Earnings Per Share (EPS): ₹61.54
Price-to-Earnings (P/E) Ratio: 162.48
Return on Equity (ROE) (FY24): 26.75%
Return on Capital Employed (ROCE) (FY24): 35.77%
Profit After Tax (PAT) (FY24): ₹72.32 Cr
(Source: Financial reports)
With the factors driving Taparia Tools' share price in mind, let's move on to examining how technical analysis can give you a clearer picture of its future movements.
How to Do a Technical Analysis of Taparia Tools Share Price

Technical analysis can be a helpful tool for gaining a deeper understanding of Taparia Tools Ltd's share price movements. By analyzing charts and patterns, you can identify key trends, support, and resistance levels that provide insights into the stock’s potential direction. Here are the key technical indicators to look for:
Moving Averages (MA)
Moving averages, including Simple and Exponential Moving Averages, can help identify whether the stock is trending upwards or downwards.
By looking at different time periods, such as 5, 10, 20, 50, 100, and 200 days, you can spot buying or selling signals based on the stock's price movement relative to the moving average.
RSI (Relative Strength Index)
The RSI helps determine if the stock is overbought or oversold. When the RSI is above 70, it might indicate that the stock is overbought and could experience a pullback.
Conversely, an RSI below 30 could suggest that the stock is oversold and may be due for a bounce.
MACD (Moving Average Convergence Divergence)
The MACD is used to spot potential buy or sell signals by observing the crossover between the MACD line and the signal line.
A crossover above the signal line can be bullish, while a crossover below could indicate a bearish trend.
CCI (Commodity Channel Index)
The CCI measures the stock's current price level relative to its average price over a set period.
A high CCI can signal an overbought condition, while a low CCI suggests the stock might be oversold.
ADX (Average Directional Index)
ADX helps measure the strength of a trend. A rising ADX value suggests a strong trend, whether upward or downward, while a declining ADX indicates a weakening trend.
ATR (Average True Range)
ATR is useful for assessing the stock's volatility. A higher ATR indicates greater price fluctuations, while a lower ATR suggests more stability.
Pivot Points
Pivot points are crucial for identifying potential support and resistance levels, helping investors predict future price movements.
By calculating pivot points, you can spot where the stock might find support during a downtrend or face resistance in an uptrend.
After examining the technical indicators, let’s take a look at the future outlook for Taparia Tools’ share price and where it might be headed.
Future Outlook & Conclusion
As of February 6, 2025, Taparia Tools Ltd's share price saw a notable increase of 4.97%, reaching ₹13.53 at 10:04 AM IST, compared to the previous closing price of ₹12.89 on February 5, 2025. This upward trend highlights positive short-term movements in its stock price, continuing the 4.97% increase from ₹12.28.
Looking at the historical performance and factors affecting the share price, Taparia Tools has shown a consistent response to market dynamics, though, like any stock, it remains subject to fluctuations.
While the stock has experienced positive movement recently, it is essential to stay informed on key developments.
For a deeper analysis and precise insights into Taparia Tools or other unlisted companies, you can reserve access to Precize. It facilitates investments in leading private companies, enabling you to buy and sell unlisted shares and pre-IPO shares.
Precize also offers detailed research reports, including balance sheets, income statements, and industry comparisons, to help you make informed decisions. Stay updated on market trends and monitor the past performance of unlisted companies for more comprehensive insights.
Disclaimer
The information provided in this blog is for educational and informational purposes only. It does not constitute financial, investment, or trading advice. The performance of Taparia Tools Ltd’s share price, like any other stock, is subject to market risks and fluctuations, which may vary based on various factors such as economic conditions, company performance, and industry trends. We recommend that you conduct thorough research or consult with a qualified financial advisor before making any investment decisions.

Stay in the Loop
Join our newsletter for exclusive access to thoughtfully curated content and we promise, no spam


Company
Our Office
Office No. 1219, The Summit Business Park, Andheri Kurla Road, Andheri East, Mumbai, Maharashtra - 400093
Find us on Googlesupport@precize.in
+91 7738336457
All trademarks and logos or registered trademarks and logos found on this Site or mentioned herein belong to their respective owners and are solely used for informational and educational purposes.
The material presented in this advertisement is for informational purposes only and should not be construed as investment advice or investment availability. It is not a recommendation of, or an offer to sell or solicitation of an offer to buy, any particular unlisted share, security, strategy, or investment product. Investing in the private market and securities involves risks, including the potential loss of money, and past performance does not guarantee future results. Market trends, data interpretations, graph projections are provided for informational and illustrative purposes and may not reflect actual future performance. Nothing on this website should be construed as personalized investment advice or should not be treated as legal, financial, or any other form of advice. Precize is not liable for financial or any other form of loss incurred by the user or any affiliated party based on information provided herein.
Precize is neither a stock exchange nor does it intend to get recognized as a stock exchange under the Securities Contracts Regulation Act, 1956. Precize is not authorized by the capital markets regulator to solicit investments. The securities traded on these platforms are not traded on any regulated exchange.
The website will be updated regularly.
Copyright © 2026 - Precize - All Rights Reserved