Horizontal Analysis of Financial Statements: Guide for Smart Investors & Managers

Many businesses don’t realise they’re heading for trouble until it’s too late. In fact, studies show that 82% of businesses fail due to poor cash flow management and the inability to identify early signs of performance decline. Recognising shifts in financial trends before they escalate can mean the difference between staying ahead and falling behind.
This is where horizontal analysis comes in. Unlike other methods that provide a snapshot of a single period, horizontal analysis compares financial performance across multiple periods, helping you spot trends over time.
By analysing how key metrics evolve, you can identify growth opportunities or potential red flags before they impact the bottom line.
In the following sections, we’ll walk you through what horizontal analysis is, how to implement it, and why it’s crucial for making smarter financial choices.
Key Takeaways
Horizontal analysis compares financial performance over multiple periods to identify trends, growth patterns, and potential issues in key metrics like revenue, expenses, and profits.
It uses dollar change and percentage change to measure growth or decline, helping businesses assess financial health over time.
Horizontal analysis applies to all major financial statements: income statement, the balance sheet, and the cash flow statement.
This method is crucial for detecting early signs of trouble, forecasting future performance, and benchmarking against competitors or industry standards.
What Is Horizontal Analysis?
Horizontal analysis is a method for evaluating financial statements over multiple periods, enabling businesses to track changes in specific line items. Comparing data from different periods, such as year-over-year, helps identify trends, growth patterns, or potential issues.
The focus is on understanding changes — whether positive or negative — in key metrics such as revenue, expenses, and profits. This approach highlights areas of concern, growth opportunities, and inconsistencies.
Horizontal analysis is used to assess financial performance, spot early signs of trouble, forecast future trends, and benchmark performance against industry standards or competitors. Through this analysis, businesses and investors can make more informed financial decisions.
The Formula
Horizontal analysis uses two key calculations:
Dollar Change: This shows the absolute difference between the current and base periods.
Formula: Current Period – Base Period = Dollar Change
Example: If revenue in 2023 is ₹5,00,000 and revenue in 2022 was ₹4,00,000, then the dollar change would be ₹1,00,000.
Percentage Change: This shows the percentage change between periods, giving a clearer picture of growth or decline.
Formula: (Dollar Change ÷ Base Period) × 100 = Percentage Change
Example: (₹1,00,000 ÷ ₹4,00,000) × 100 = 25% growth.
Example: Revenue Comparison
Here’s a simple example of how horizontal analysis works:
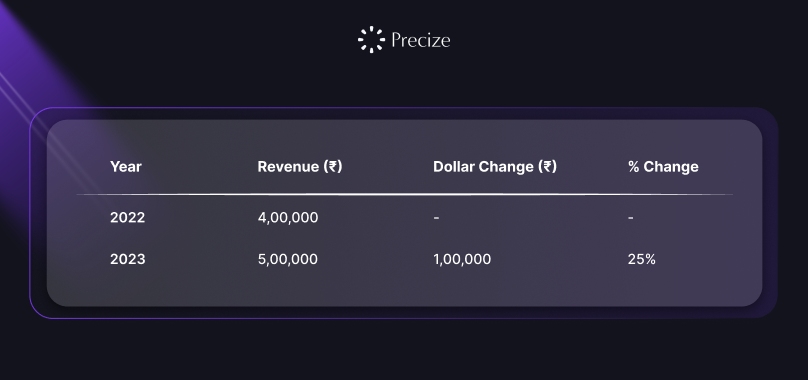
In this example, revenue has increased by ₹1,00,000 (a 25% growth) from 2022 to 2023.
Which Statements Can You Apply It To?
Horizontal analysis can be applied to all three major financial statements:
Income Statement: Track revenue, expenses, and profit over time to gauge profitability.
Balance Sheet: Compare assets, liabilities, and equity across periods to identify shifts in financial health.
Cash Flow Statement: Evaluate operating, investing, and financing activities over time to spot liquidity trends.
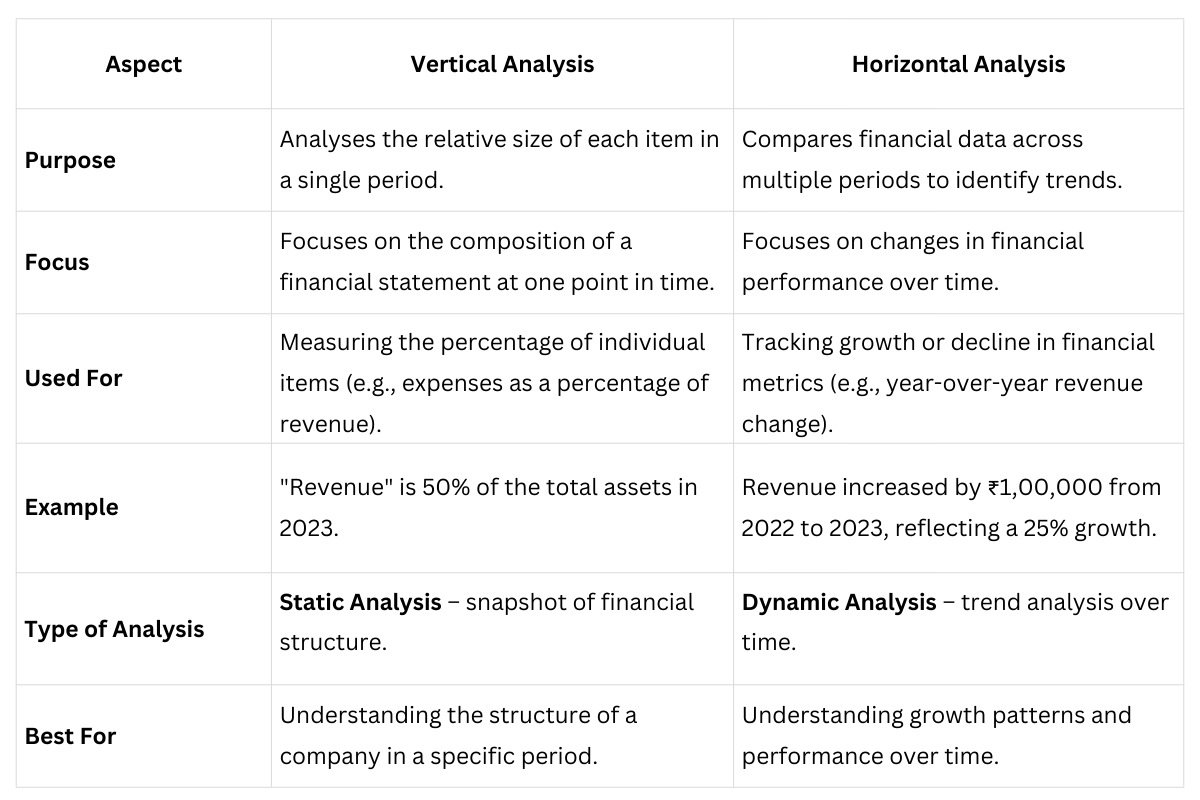
How Horizontal Analysis Differs from Vertical/Common-Size Analysis
Horizontal analysis and vertical (or common-size) analysis are often confused, but they serve distinct purposes in financial evaluation.
Understanding the difference can help clarify how to use these tools for insightful analysis best.
Also Read: Timing The Market Vs. Time In Market
Let’s now discuss why horizontal analysis is essential for spotting trends, forecasting future performance, and identifying potential risks.
Why Should You Use Horizontal Analysis? (What It Reveals)
Horizontal analysis is an essential tool for any business or investor looking to understand long-term financial performance. It helps uncover trends, performance shifts, and risks that might otherwise go unnoticed.
1. Trend Identification: Growth, Decline, Flat Periods
One of the key advantages of horizontal analysis is its ability to highlight trends in a company’s performance. By comparing financial figures across multiple periods, you can easily spot whether a particular line item is growing, shrinking, or remaining stable.
Growth: A consistent upward trend, such as a 15% year-over-year increase in revenue, signals positive performance and potential for future gains.
Decline: A steady decline in profits or revenue could indicate underlying problems that need to be addressed.
Flat Periods: Identifying periods where performance stagnates can help businesses take proactive measures to reignite growth or make necessary adjustments.
For example, suppose a manufacturing company notices a consistent 10% annual decline in revenue from 2019 to 2023.
In that case, this signals the need for a deeper analysis to understand the root cause—whether it’s market conditions, competition, or internal inefficiencies.
2. Performance Evaluation: How Expenses, Profits, and Assets Move Over Time
Horizontal analysis provides a clear view of how key financial metrics such as expenses, profits, and assets change over time.
This makes it easier to assess whether the company is managing its resources effectively and where adjustments might be necessary.
Expenses: Tracking the growth or reduction in expenses, especially operational costs, helps determine if cost-cutting measures are working or if inefficiencies are creeping into the business.
Profits: Monitoring year-over-year profit margins shows whether the company is improving its bottom line or needs better revenue management.
Assets: Evaluating the growth of assets such as cash reserves, inventory, or fixed assets helps identify whether the company is effectively utilising its resources for long-term growth.
For example, a technology firm might see an increase in R&D expenses over three years. Horizontal analysis can confirm whether this increase is translating into higher profits or market share, which could justify the investment.
3. Benchmarking & Forecasting: Using Past Changes to Project or Compare
Another major benefit of horizontal analysis is its ability to support benchmarking and forecasting. By assessing historical performance, you can set realistic targets and compare your company’s results with industry standards or competitors.
Benchmarking: Compare key financial metrics to those of similar companies or industry averages. This helps identify areas where the company is outperforming or underperforming relative to peers.
Forecasting: Historical trends provide a basis for predicting future performance. By analysing patterns, you can make more informed predictions about potential growth, profitability, or risk factors.
For example, an Indian-listed textile firm may use horizontal analysis to compare its growth rate with the industry average.
If the company consistently lags, this insight could drive strategic decisions to enhance competitiveness, such as improving production efficiency or expanding into new markets.
4. Risk Spotting: Unusual Jumps or Declines in Line-Items
Horizontal analysis is also a valuable tool for spotting potential risks that could affect the company's financial health.
Unusual Increases in Expenses: If operating costs spike unexpectedly without a corresponding increase in sales or production, this could point to inefficiencies or issues like rising raw material prices.
Revenue Drops: A sudden decrease in revenue can signal problems such as declining demand, lost customers, or an ineffective sales strategy.
For instance, a manufacturing company might see a sudden 20% increase in raw material costs. Horizontal analysis can help uncover this trend over multiple periods, prompting an internal review of supplier contracts or production processes to identify the cause.
At Precize, we make investing in alternative opportunities simple and accessible. Whether you’re looking to explore pre-IPO shares or secure short-term returns through global trade finance, our platform provides the tools and insights you need to make informed financial decisions.
Now that you understand the benefits, let’s dive into how to implement horizontal analysis systematically, step by step.
How to Conduct Horizontal Analysis — Step-by-Step
Horizontal analysis is an effective tool for tracking a business's performance over time. By following a structured process, you can gain deeper insights into your company's financial health.
Here's a step-by-step guide on how to conduct horizontal analysis to get the most out of your financial data.
Step 1: Choose the Base Period
The base period serves as the starting point for your comparison. It provides a reference point for measuring growth or decline in subsequent periods.
Tip: Choose a base period that makes sense for your analysis, whether it’s the most recent year, a period that reflects normal operations, or a time of significant change (e.g., a year before a new product launch). The base period should offer a representative snapshot of your company’s financial health.
Step 2: Collect Financial Statements for Relevant Years
Next, gather the financial statements for the periods you want to compare—typically, three to five years for a more robust trend analysis.
Tip: Ensure consistency in the statements you're comparing. Use the same financial reports (income statement, balance sheet, and cash flow statement) for each period to avoid discrepancies that might distort your analysis.
Step 3: Compute Absolute Changes for Each Line Item
For each line item in your financial statement (e.g., revenue, operating expenses), calculate the absolute change from one period to the next.
Example:
2022 Revenue: ₹4,00,000
2023 Revenue: ₹5,00,000
Absolute Change: ₹5,00,000 − ₹4,00,000 = ₹1,00,000
This shows the actual monetary change in each category.
Step 4: Compute Percentage Changes
Once you’ve calculated the absolute change, it’s time to calculate the percentage change. This will help you understand the rate of growth or decline relative to the base period.
Formula:
Percentage Change = (Absolute Change ÷ Base Period Value) × 100
Example:
(₹1,00,000 ÷ ₹4,00,000) × 100 = 25%
This indicates that the revenue grew by 25% from 2022 to 2023.
Step 5: Interpret the Results
Interpret the percentage changes to understand what they mean for your business. Pay attention to any significant fluctuations or patterns that could indicate a shift in performance.
Tip: For example, a 5% increase in revenue may be positive in stable market conditions, but a 50% drop in operating income could signal inefficiencies or an external factor (like rising raw material costs). Identifying such shifts early can help make informed decisions.
Step 6: Adjust for Anomalies
Sometimes, one-off events or changes in accounting policies can distort trends. For instance, an unusually high revenue spike due to the sale of a large asset or a tax adjustment could skew results.
Tip: Be cautious about interpreting trends based on anomalous data. Adjust for any non-recurring items, such as asset sales, and ensure you’re focusing on sustainable, ongoing operations.
Example: If your company received a one-time government grant in 2022, remove that amount from the revenue to see the true performance trend.
Best Practices for Horizontal Analysis
To ensure your horizontal analysis provides accurate and actionable insights, follow these best practices:
Consistent Accounting Methods: Use consistent accounting methods across periods to avoid inconsistencies that can affect your analysis.
Sufficient Time Periods: Include enough periods for the comparison. A minimum of 3 years is often ideal for observing meaningful trends and avoiding anomalies caused by single-year fluctuations.
Focus on Key Metrics: Focus on the most important financial metrics—revenue, operating expenses, profit margins, and assets—so you can spot changes that have a real impact on your business.
Use Visuals: Tables and graphs can make the changes easier to spot, especially when analysing multiple years. For example, visualise revenue trends over five years to easily see periods of growth and decline.
Example of Horizontal Analysis in Action
Here’s a simple example using horizontal analysis for revenue, operating expenses, and profits:
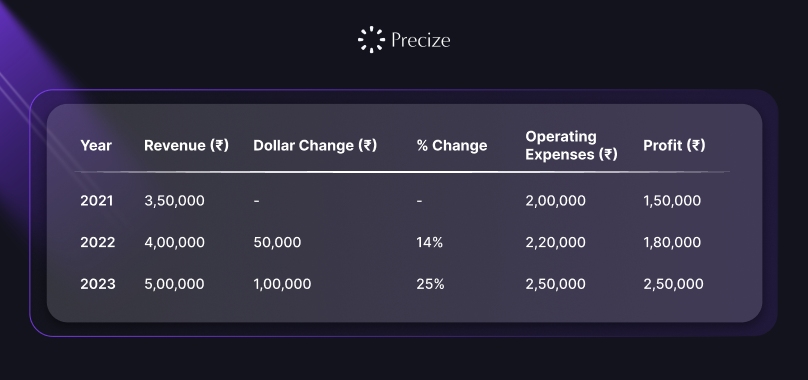
Interpretation:
Revenue grew by 14% in 2022 and 25% in 2023.
Operating Expenses also increased, but at a slower rate, indicating better cost control.
Profit increased significantly, suggesting improved operational efficiency.
This simple process allows you to assess financial health over time and uncover trends that can guide strategic decisions.
Also Read: How do you profit from investing in unlisted shares in India
While horizontal analysis is a powerful tool, there are several pitfalls and limitations to be considered. Let’s review them to ensure accurate analysis.
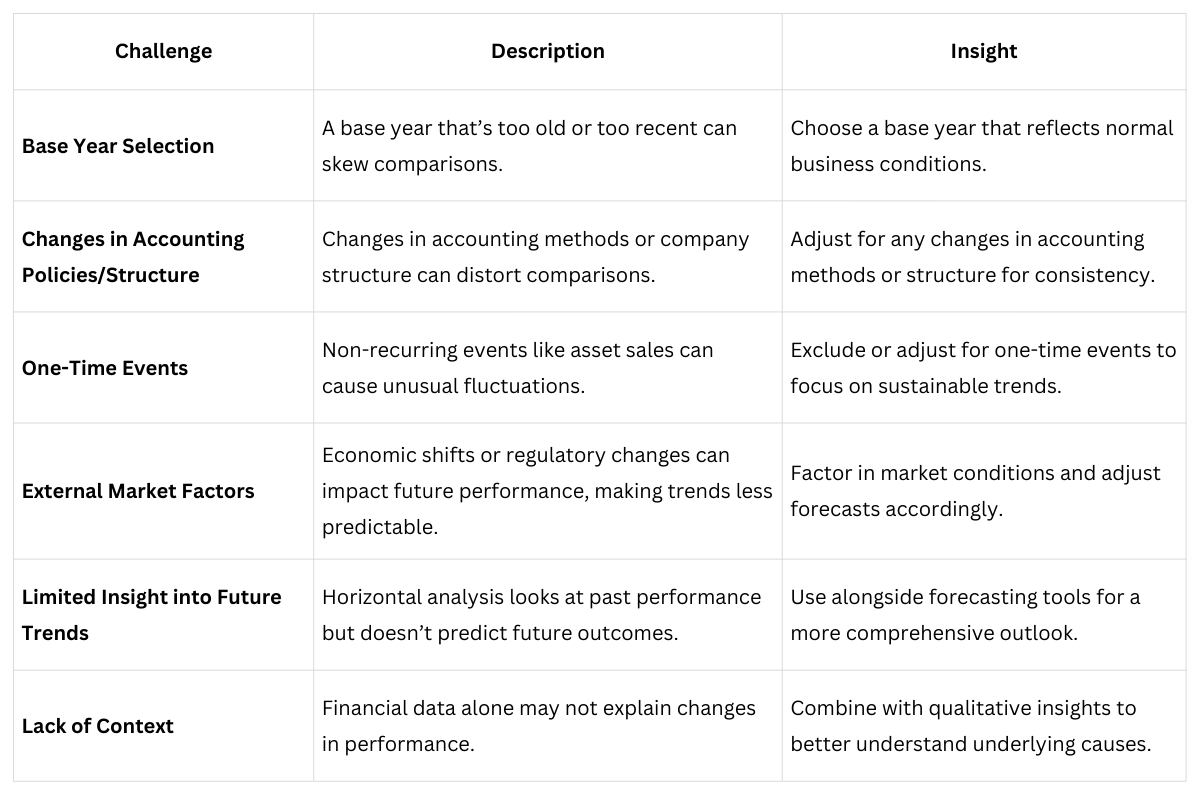
What to Look Out For — Key Pitfalls and Limitations
While horizontal analysis is a powerful tool for evaluating financial performance over time, there are several potential pitfalls and limitations to be aware of.
These factors can distort your findings and lead to inaccurate conclusions if not carefully considered.
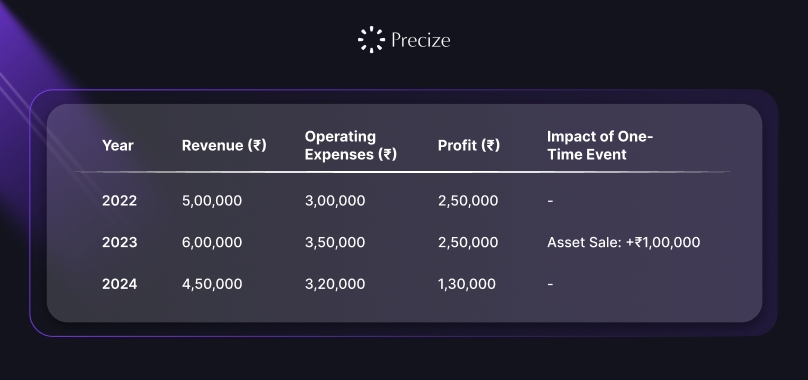
Example: How One-Time Events Can Skew Results
Conclusion
Horizontal analysis is a powerful tool for investors, managers, and analysts to track financial performance over time. For investors, it highlights growth trends and cost efficiency, while managers can use it to identify areas of improvement.
Analysts can benchmark performance against peers and build predictive models.
Even for Indian companies, with their unique regulatory challenges, horizontal analysis remains invaluable in uncovering trends and potential issues. By focusing on key metrics and using a 3–5 year horizon, you can gain actionable insights into a company's financial health.
Precize offers you the opportunity to invest in private equity and private-credit markets with as little as ₹10,000, opening doors to high-growth opportunities typically reserved for institutions.
Backed by in-depth research reports and data-driven insights, we help you to make informed decisions and diversify your portfolio with pre-IPO shares and global trade finance deals.
Reserve access with Precize today!
FAQs
Q: How can horizontal analysis help a company spot financial inefficiencies?
A: Horizontal analysis allows a business to track how costs evolve over time. A significant increase in operating expenses without a corresponding rise in revenue can highlight inefficiencies, prompting the company to review cost management strategies.
Q: Can horizontal analysis predict future financial trends?
A: While horizontal analysis focuses on historical data, it provides a solid foundation for forecasting. By identifying growth patterns or declines, businesses can make more informed predictions about future performance and plan accordingly.
Q: How do I adjust horizontal analysis for changes in accounting policies?
A: When changes in accounting policies occur, ensure that financial statements are adjusted to reflect these changes consistently across periods. This ensures that the comparison remains valid and that any discrepancies caused by policy shifts are accounted for.
Q: Is horizontal analysis more useful for short-term or long-term business planning?
A: Horizontal analysis is beneficial for both short- and long-term planning. For short-term needs, it helps identify immediate trends in cash flow or profits, while for long-term strategies, it can highlight sustained growth or recurring challenges.
Q: How often should a business conduct horizontal analysis?
A: Horizontal analysis should ideally be conducted annually to assess yearly performance, but more frequent analysis (quarterly or monthly) can provide valuable insights, especially for fast-moving industries or businesses with fluctuating revenue streams.

Stay in the Loop
Join our newsletter for exclusive access to thoughtfully curated content and we promise, no spam


Company
Our Office
Office No. 1219, The Summit Business Park, Andheri Kurla Road, Andheri East, Mumbai, Maharashtra - 400093
Find us on Googlesupport@precize.in
+91 7738336457
All trademarks and logos or registered trademarks and logos found on this Site or mentioned herein belong to their respective owners and are solely used for informational and educational purposes.
The material presented in this advertisement is for informational purposes only and should not be construed as investment advice or investment availability. It is not a recommendation of, or an offer to sell or solicitation of an offer to buy, any particular unlisted share, security, strategy, or investment product. Investing in the private market and securities involves risks, including the potential loss of money, and past performance does not guarantee future results. Market trends, data interpretations, graph projections are provided for informational and illustrative purposes and may not reflect actual future performance. Nothing on this website should be construed as personalized investment advice or should not be treated as legal, financial, or any other form of advice. Precize is not liable for financial or any other form of loss incurred by the user or any affiliated party based on information provided herein.
Precize is neither a stock exchange nor does it intend to get recognized as a stock exchange under the Securities Contracts Regulation Act, 1956. Precize is not authorized by the capital markets regulator to solicit investments. The securities traded on these platforms are not traded on any regulated exchange.
The website will be updated regularly.
Copyright © 2026 - Precize - All Rights Reserved