Net Present Value vs IRR: The Difference You Must Know

Making the right financial choice can feel tricky, especially when numbers and formulas start piling up. You might often wonder why two methods seem to give different answers or which one truly reflects the real value. That’s where understanding IRR vs NPV becomes crucial.
In this blog, you will see exactly what the Internal Rate of Return (IRR) is, how it is calculated, its components, and its advantages and limitations. You will also learn about Net Present Value (NPV), its formula, calculation process, benefits, and drawbacks.
Finally, we will explain the key differences between IRR and NPV, helping you make sense of both methods and how they compare in real financial decisions.
Keep scrolling to explore!
Quick Overview
IRR: Useful for comparing efficiency and return rates, but can be misleading for irregular cash flows or multiple IRRs.
NPV: Accounts for the time value of money, measures absolute value, and is better for comparing projects of different sizes.
IRR vs NPV: IRR shows the percentage return of cash flows, while NPV measures the total value added in today’s terms.
What Is the Internal Rate of Return (IRR)?
The Internal Rate of Return (IRR) is the rate at which the net cash flows of a project or financial decision become zero. It shows the potential growth rate of cash flows over time. IRR helps in comparing different options by indicating which one may generate better returns. Essentially, it is the break-even rate where the present value of inflows equals the initial outflow.
To use IRR effectively, it helps to understand the main parts that make up the calculation and the formula behind it.
Components & Formula of Internal Rate of Return
Before calculating IRR, it’s important to understand its key components and the formula used.
Components of IRR
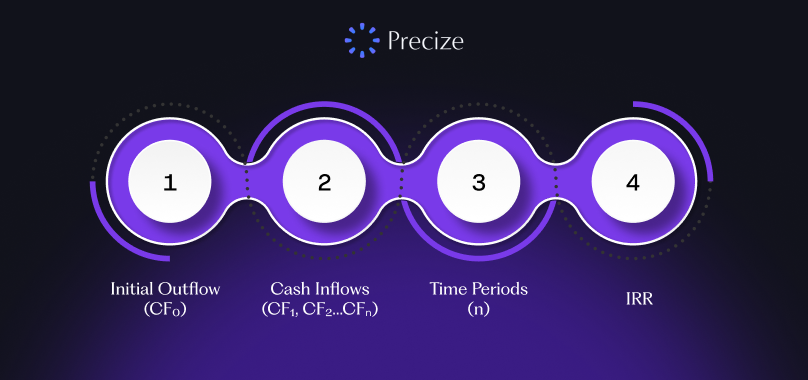
Initial Outflow (CF₀): This is the starting amount spent or paid out, usually shown as a negative number because it’s money going out.
Cash Inflows (CF₁, CF₂…CFₙ): These are the expected returns or money coming in over different periods after the initial outflow.
Time Periods (n): The number of periods (years, months) over which these cash flows occur.
IRR: The rate you are trying to find that makes the present value of inflows equal to the initial outflow.
IRR Formula
The IRR is calculated by setting the Net Present Value (NPV) to zero:
0 = CF0 + CF1 / (1 + IRR)^1 + CF2 / (1 + IRR)^2 + ... + CFn / (1 + IRR)^n
Where:
CF0CF0 = initial cash outflow
CF1,CF2,…,CFnCF1,CF2,…,CFn = cash inflows in future periods
IRRIRR = rate to be determined
Because solving this manually can be tricky, tools like Excel or financial calculators are commonly used.
Simplified Formula for Single Period
If there’s only one cash inflow after the initial outflow, IRR can be calculated easily as:
IRR = (FV / PV)^(1/n) - 1
Where:
FVFV = future value of the inflow
PVPV = initial outflow (positive number)
nn = number of periods
To make this concept easier to grasp, let’s look at an example that puts the IRR formula into action.
Example of Internal Rate of Return
Suppose you put ₹1,00,000 into a project today and expect to receive cash over the next three years. The IRR is the rate at which the total value of these future cash flows equals the initial ₹1,00,000, the point where net present value (NPV) becomes zero.
For example, if the expected cash flows are ₹30,000 in the first year, ₹40,000 in the second year, and ₹50,000 in the third year, the IRR is the rate that balances these inflows so that their present value matches your initial ₹1,00,000 exactly.
With the example in mind, let’s take a closer look at the benefits and drawbacks of using IRR.
Advantages & Limitations of Internal Rate of Return
When looking at IRR vs NPV, knowing the strengths and weaknesses of IRR can help you understand when it is useful.
Advantages of IRR
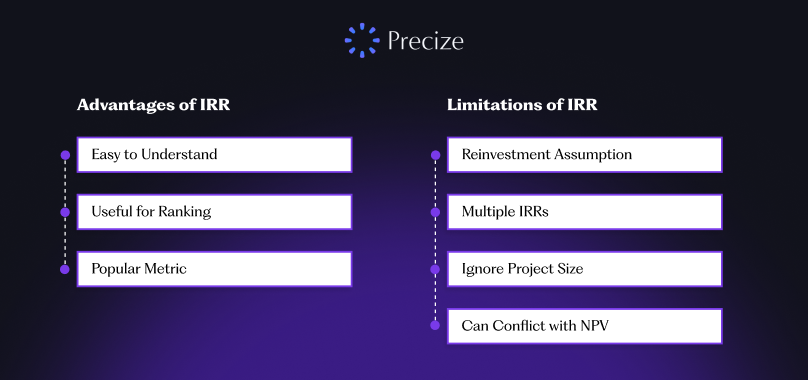
Easy to Understand: IRR expresses the expected return as a percentage, making it simple to grasp and compare across different projects.
Useful for Ranking: It helps quickly rank projects based on their return rate, especially when projects are similar in size and duration.
Popular Metric: IRR is widely used because it gives a clear, intuitive idea of a project’s potential return at a glance.
Limitations of IRR
Reinvestment Assumption: IRR assumes that any cash flows received along the way are reinvested at the same rate, which may not always be realistic.
Multiple IRRs: Projects with unusual cash flow patterns (switching between positive and negative) can have more than one IRR, making interpretation tricky.
Ignore Project Size: IRR focuses on percentage return, not the total value, so a smaller project with a higher IRR might seem better than a bigger one that actually brings in more money.
Can Conflict with NPV: For mutually exclusive projects, IRR might suggest a different choice than NPV, which measures total value creation more reliably.
After looking at IRR’s advantages and limitations, it’s important to consider another key metric, NPV.
What Is Net Present Value (NPV)?
Net Present Value is the difference between the present value of expected cash inflows and the initial amount spent. It shows whether future cash flows, when discounted to today’s value, are greater or smaller than the starting amount. A positive NPV indicates a gain, while a negative NPV indicates a loss. Essentially, NPV helps measure the overall value created by a project or decision.
Now that you know what NPV represents, it’s important to understand the main components that go into calculating it and how the formula works.
Components & Formula of Net Present Value
To understand Net Present Value, it’s important to know its main components and the formula.
Components of NPV
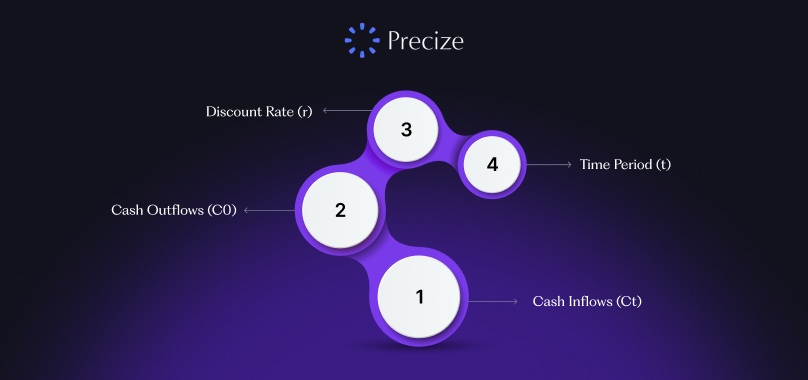
Cash Inflows (Ct): The money expected to be received at different times in the future.
Cash Outflows (C0): The money spent initially or during the project’s duration.
Discount Rate (r): The rate used to bring future cash flows to present value, often reflecting the cost of capital or expected rate of return.
Time Period (t): The specific time (usually in years) when each cash flow occurs.
NPV Formula
NPV = (C1 / (1 + r)^1) + (C2 / (1 + r)^2) + ... + (Cn / (1 + r)^n) - C0
Where:
Ct = Cash inflow at time t
C0 = Initial cash outflow
r = Discount rate per period
t = Time period
n = Total number of periods
To make the concept of NPV more tangible, let’s walk through a practical example.
Example of Net Present Value
Consider a project or purchase where money will flow in and out over several years.
For example, suppose you are planning to buy a small business that is expected to generate cash every year for a few years. You estimate these future cash amounts and discount each one to its present value using a rate that reflects the cost and risk of money. Adding all these present values gives the total present value of the future cash flows.
If this total is higher than the price you pay today, the difference is the NPV. A positive NPV indicates the project or purchase is likely to create value, while a negative NPV suggests it may not be worthwhile.
For instance:
Total present value of future cash flows = ₹23.5 million
Price to buy the business = ₹20 million
NPV = ₹23.5 million − ₹20 million = ₹3.5 million
This ₹3.5 million shows the extra value gained after considering the time value of money.
With this example in mind, let’s look at the key benefits and potential drawbacks of using NPV.
Advantages & Limitations of Net Present Value
Understanding the strengths and weaknesses of NPV can help you see when it is most useful compared to other financial measures.
Advantages of Net Present Value
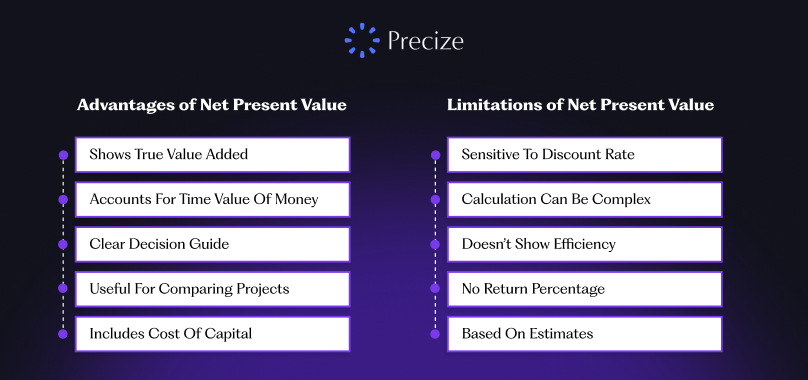
Shows True Value Added: NPV indicates the actual monetary gain or loss in today’s terms, making it clear how much value a project or decision contributes.
Accounts for Time Value of Money: It discounts future cash flows, reflecting that money today is worth more than the same amount in the future.
Clear Decision Guide: A positive NPV signals value creation, making it easier to decide whether a project is worthwhile.
Useful for Comparing Projects: NPV is effective for comparing projects of different sizes or durations since it measures absolute value rather than a percentage.
Includes Cost of Capital: By using a discount rate based on the cost of capital, it ensures the calculation reflects the minimum expected return.
Limitations of Net Present Value
Sensitive to Discount Rate: NPV results depend heavily on the discount rate chosen; small changes in the rate can have a big impact.
Calculation Can Be Complex: Determining NPV can be tricky, especially with irregular cash flows or long-term projects, without proper tools.
Doesn’t Show Efficiency: While it shows total value, it may not indicate how efficient a project is relative to its size or duration.
No Return Percentage: NPV measures total value added but does not provide the rate of return, which makes quick comparisons harder.
Based on Estimates: Since NPV relies on projected cash flows, inaccurate forecasts can lead to misleading results.
Knowing NPV alone is helpful, but comparing it with IRR highlights how each metric approaches financial evaluation differently.
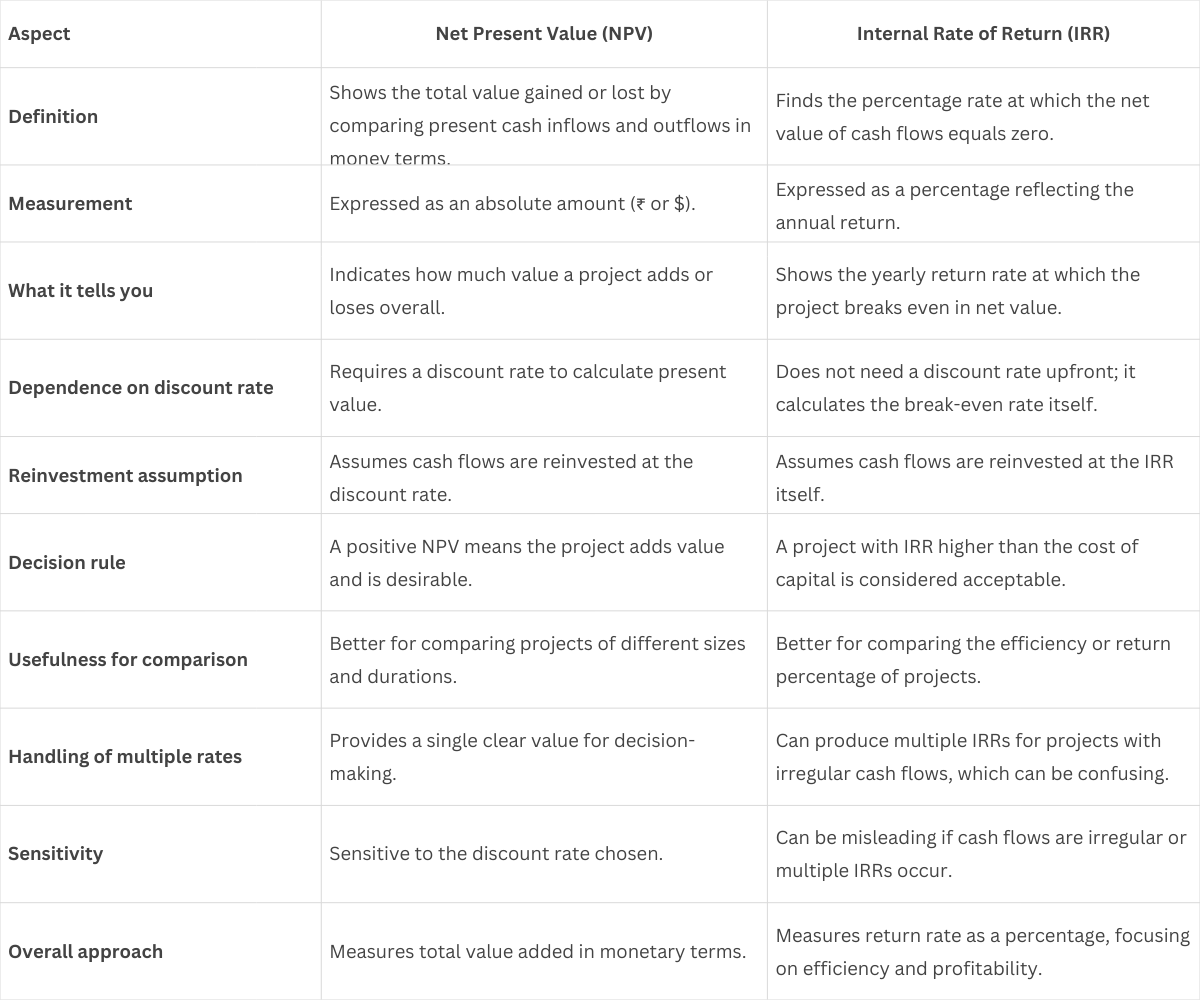
Difference Between IRR vs NPV
When comparing financial metrics, it’s important to understand how IRR and NPV differ. The table below highlights the key differences between the two.
Conclusion
IRR and NPV offer different but complementary ways to evaluate financial options. NPV shows the total value added in today’s terms, while IRR reflects the rate of return on cash flows. Using both together helps make better decisions and compare options more effectively.
For those exploring alternative opportunities in India, Precize provides access to private equity opportunities, making it easier to diversify your portfolio.
Reserve your access today and broaden your investment opportunities with Precize!
FAQs
1. Can a project have a positive NPV but a lower IRR than expected?
Yes, it is possible for a project to have a positive NPV while the IRR is lower than the expected return or cost of capital. NPV measures the absolute value added, while IRR shows the percentage return. This difference is common for large projects with significant cash inflows over a long period.
2. Which metric is better for comparing projects of different sizes: NPV or IRR?
NPV is generally better for comparing projects of different sizes because it measures the total value added in monetary terms. IRR shows efficiency as a percentage, which can make smaller projects with high rates look more attractive even if their total value is lower.
3. How does the timing of cash flows affect IRR and NPV?
The timing of cash flows is critical for both metrics. NPV discounts future cash flows to present value, so earlier inflows contribute more to total value. IRR, meanwhile, calculates the break-even rate, which can be affected if cash flows are uneven or delayed, sometimes leading to multiple IRRs.
4. Can NPV be negative while IRR is still acceptable?
Yes, in rare cases, a project may show a negative NPV if the chosen discount rate is higher than the actual returns, but the IRR might still exceed the company’s minimum acceptable rate. This situation emphasizes why both metrics should be considered together rather than in isolation.
5. Why do finance professionals use both IRR and NPV together?
Using both IRR and NPV together provides a more complete picture of a project’s value. NPV indicates the total value added, while IRR shows the efficiency of the returns. Comparing both helps in making informed decisions, especially for projects with different scales, durations, or cash flow patterns.
Disclaimer
This blog is intended to explain financial concepts like IRR and NPV in a simplified and educational manner. The examples, figures, and scenarios are illustrative and may not reflect real outcomes in actual projects. Readers should not rely solely on this information for financial decisions and are encouraged to consult professional guidance for specific situations. The content aims to enhance understanding and clarity, but individual results may vary depending on unique circumstances.

Stay in the Loop
Join our newsletter for exclusive access to thoughtfully curated content and we promise, no spam


Company
Our Office
Office No. 1219, The Summit Business Park, Andheri Kurla Road, Andheri East, Mumbai, Maharashtra - 400093
Find us on Googlesupport@precize.in
+91 7738336457
All trademarks and logos or registered trademarks and logos found on this Site or mentioned herein belong to their respective owners and are solely used for informational and educational purposes.
The material presented in this advertisement is for informational purposes only and should not be construed as investment advice or investment availability. It is not a recommendation of, or an offer to sell or solicitation of an offer to buy, any particular unlisted share, security, strategy, or investment product. Investing in the private market and securities involves risks, including the potential loss of money, and past performance does not guarantee future results. Market trends, data interpretations, graph projections are provided for informational and illustrative purposes and may not reflect actual future performance. Nothing on this website should be construed as personalized investment advice or should not be treated as legal, financial, or any other form of advice. Precize is not liable for financial or any other form of loss incurred by the user or any affiliated party based on information provided herein.
Precize is neither a stock exchange nor does it intend to get recognized as a stock exchange under the Securities Contracts Regulation Act, 1956. Precize is not authorized by the capital markets regulator to solicit investments. The securities traded on these platforms are not traded on any regulated exchange.
The website will be updated regularly.
Copyright © 2026 - Precize - All Rights Reserved