Types of Stock Market Analysis Explained

Did you know that in FY25, domestic brokerages in India added a record 41.1 million demat accounts? This pushed the total to 192.4 million, marking the highest-ever annual increase in absolute terms.
Despite the rapid growth in market participation, understanding price movements remains challenging for many investors. They often face excessive information, conflicting opinions, and limited tools to make sense of market behaviour. Identifying reliable signals amid this market noise is the real challenge, making a clear method of analysis essential.
In this blog, you’ll learn the main types of stock market analysis, how they work, where they fit, and how they help you approach decisions confidently.
Key Takeaways
Understand Market Movements: Analysis helps interpret price trends, company performance, and sector dynamics.
Four Core Approaches: Fundamental (value), Technical (timing), Derivative (risk/sentiment), Industry (sector trends).
Combine Methods: Layering techniques provide a clearer, structured, and disciplined investment approach.
Risk Awareness: Structured analysis reduces reliance on speculation, media hype, and impulsive decisions.
Strategic Application: Insights guide portfolio allocation across equities, pre-IPO opportunities, and alternative assets.
What is Stock Market Analysis?
Stock market analysis is the process of evaluating securities, industries, and overall market conditions to determine the strength or weakness of an opportunity. It helps you interpret financial statements, price trends, business performance, sector patterns, and market sentiment to make informed, well-structured decisions.
For retail individuals, analysis provides clarity, helps assess risk, and prevents overpaying. For institutional teams, it strengthens due diligence and reduces exposure to biased or incomplete data. For advisers, it enhances the credibility of recommendations and strategic planning.
Why Conducting Thorough Stock Market Analysis Matters?
Practical analysis enables investors to make informed decisions, identify opportunities, and mitigate risks. It provides a structured approach to understanding market patterns, evaluating companies, and aligning decisions with financial goals, ensuring disciplined and data-driven investing.
Below are several key advantages of conducting thorough stock market analysis:
Understand Risk Clearly: Analysis helps you assess market volatility, potential losses, and the long-term feasibility of investments.
Make Better Decisions: Relying on structured data rather than speculation improves your investment accuracy and outcomes.
Avoid Blind Tips: It reduces dependency on rumours, media hype, or hearsay-driven decisions.
Build Investment Discipline: Consistent analysis promotes long-term thinking over impulsive, emotion-driven actions.
Optimise Portfolio Diversification: Analysis guides strategic allocation across stocks, pre-IPO opportunities, digital assets, and alternative investments, ensuring balanced risk exposure.
Now that you understand what stock market analysis entails, let’s explore the main types of analysis and see when each method proves most effective.
4 Essential Types of Stock Market Analysis You Need to Know
To make sense of market movements, it’s essential to rely on structured analysis rather than guesswork. Different approaches highlight unique aspects, such as company performance, price trends, or sector dynamics, helping you make informed decisions.
Below are the four key types of stock market analysis that play a crucial role in decision-making:
1. Fundamental Analysis
Fundamental analysis evaluates a company’s financial health, operational performance, and overall market environment to determine whether its stock price reflects its intrinsic value.
How It Works
Analysts study financial statements (balance sheet, income statement, cash flow) to understand profitability, debt levels, and liquidity.
Examines macroeconomic factors, including GDP growth, interest rates, inflation, and sector performance.
Uses ratios and metrics to gauge financial health and market valuation.
Key Metrics
The following metrics help assess a company’s financial health and market value:
Earnings per Share (EPS): Net profit divided by total outstanding shares. A higher EPS indicates greater profitability. Example: EPS of ₹20 is better than ₹5 for companies in the same sector.
Price-to-Earnings (P/E) Ratio: Stock price divided by EPS. A P/E of 25 means investors pay ₹25 for every ₹1 of earnings. A high P/E ratio may indicate high growth expectations, while a low P/E ratio could indicate undervaluation or poor performance.
Price/Earnings to Growth (PEG) Ratio: P/E ratio divided by earnings growth rate. Helps compare companies with different growth rates. PEG < 1 often signals undervaluation relative to growth.
Price-to-Book (P/B) Ratio: Stock price divided by book value per share. A P/B ratio greater than 1 indicates that the market values the company above its net asset value, reflecting its future growth potential.
Return on Equity (ROE): It shows how efficiently a company uses shareholders’ money to generate profit. A higher ROE indicates greater profit per unit of invested capital.
Dividend Payout Ratio: Percentage of earnings paid as dividends. Shows how much profit is returned to shareholders versus reinvested in the business.
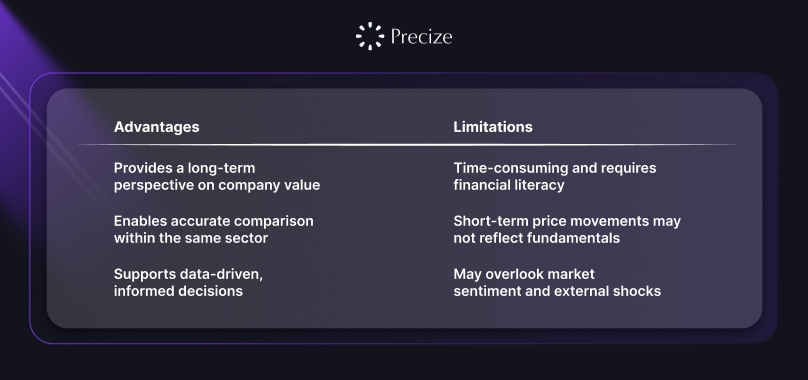
Best for: Long-term exploration and evaluating a company’s intrinsic value.
Scenario Example: A retail investor reviews the P/E, PEG, and ROE of a pre-IPO company to evaluate if its stock price aligns with expected growth.
2. Technical Analysis
Technical analysis studies historical market data, including price movements and trading volumes, to forecast potential future price trends.
How It Works
Technical analysis relies on the following three key assumptions:
Market reflects all Information: Prices already incorporate known factors like earnings, news, and economic conditions.
Prices follow trends: Once established, trends typically persist until clear reversal signals emerge.
History repeats itself: Market psychology causes patterns to recur, such as bullish or bearish trends.
Key Metrics
The following indicators and tools are used to analyse past price movements, trends, and market momentum in order to forecast potential future stock behaviour:
Trend Lines: Lines drawn to connect consecutive highs or lows to indicate market direction.
Support and Resistance: Price levels where a stock tends to stop falling (support) or rising (resistance).
Moving Averages (MA, EMA): Average prices over a period to smooth fluctuations and identify trends.
Relative Strength Index (RSI): Measures speed and change of price movements; indicates overbought or oversold conditions.
MACD (Moving Average Convergence Divergence): Shows trend direction and momentum by comparing short- and long-term moving averages.
Bollinger Bands: Measure price volatility; wider bands indicate higher volatility, narrower bands indicate stability.
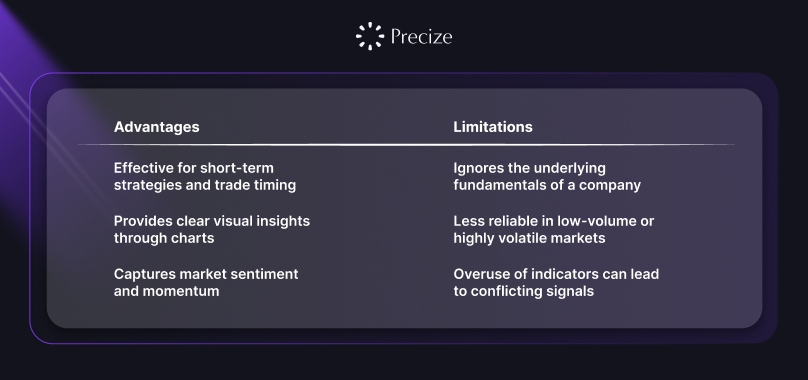
Best for: Traders and those monitoring short-term price trends.
Scenario Example: A trader uses the RSI and MACD to determine when to buy or sell a stock based on overbought or oversold conditions.
3. Derivative Analysis
Derivative analysis studies financial contracts (futures, options, swaps) whose value depends on underlying assets, helping investors understand risk and anticipate market moves.
How It Works
Tracks implied volatility and derivatives pricing to gauge market expectations.
Helps hedge positions and manage portfolio risk.
Provides insights into investor sentiment and potential price directions.
Key Metrics
The following are the main indicators used in derivative analysis:
Futures and Options: Contracts to buy/sell assets at a future date at predetermined prices.
Implied Volatility: Expected price fluctuation; high volatility indicates higher risk or market uncertainty.
The Greeks (Delta, Gamma, Theta, Vega): Metrics to measure sensitivity to price changes, time decay, and volatility.
Open Interest: Total number of active contracts; indicates market participation and strength of trend.
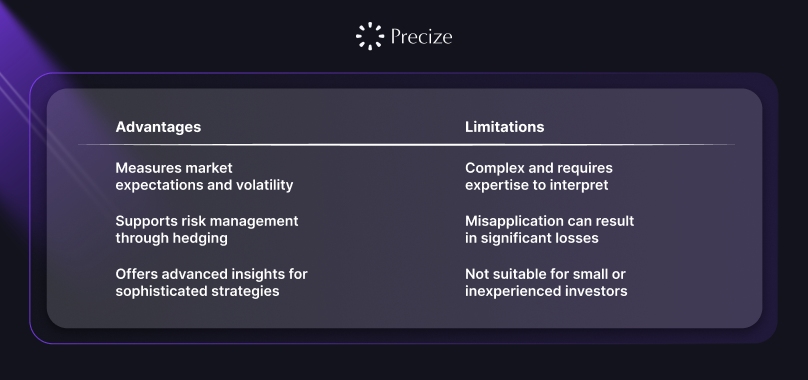
Best for: Institutional teams and experienced advisers managing risk or exploring sophisticated strategy.
Scenario Example: An institutional team studies options volumes and implied volatility to anticipate sector-wide price swings and adjust portfolios accordingly.
4. Industry Analysis
Industry analysis evaluates a sector’s health, growth trends, regulatory environment, and competitive landscape to identify potential opportunities or risks.
How It Works
Reviews market size, growth rate, and adoption trends.
Studies regulatory changes and macroeconomic conditions affecting the sector.
Compares competitors’ performance and market share to identify leaders and laggards.
Key Indicators Used
The following indicators are commonly used in industry analysis:
Market Growth Projections: Expected increase in revenue or demand.
Regulatory Environment: Policies, tariffs, and compliance requirements affecting profitability.
Competition and Market Share: Indicates industry dynamics and potential challenges.
Macro Trends: Technological adoption, consumer behaviour, or economic cycles impacting the sector.
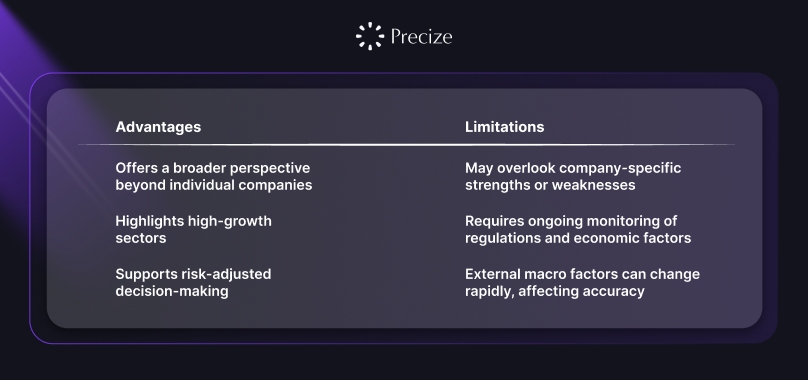
Best for: Understanding sector dynamics and guiding portfolio allocation.
Scenario Example: An adviser evaluates the IT sector’s growth and regulatory trends before recommending that clients explore opportunities in leading tech companies.
No single technique is the “best” in isolation. Many successful investors combine multiple approaches, including fundamentals for value, technical analysis for timing, derivatives for risk insight, and industry trends for context. Using them together creates a structured, informed approach, reducing guesswork and improving decision quality.
How to Combine Stock Market Analysis Methods?
Relying on a single type of analysis can leave gaps in your understanding of the market. Combining methods allows you to assess opportunities from multiple angles and make better-informed decisions:
Fundamental and Technical Analysis: Use fundamental analysis to identify companies with strong financial health and growth potential. Then, apply technical analysis to time entries and exits, spotting trends and momentum for short-term optimisation.
Fundamental and Industry Analysis: Evaluate a company’s intrinsic value alongside the performance, regulatory environment, and growth prospects of its sector. This prevents overvaluing a strong company in a declining industry or missing opportunities in emerging sectors.
Derivative and Technical Analysis: For sophisticated strategies, monitoring options volumes, implied volatility, and technical indicators helps anticipate short-term price swings while managing exposure through hedging.
Full Mix Approach: Retail investors can combine fundamentals and industry trends to gain medium- to long-term clarity. Institutional teams often add derivatives and technical insights to manage portfolio risk, optimise timing, and capture market opportunities efficiently.
Also Read: How to Buy Shares in Stock Market Online in India
Align the combination with your goals, risk tolerance, and available analysis time. A structured, layered approach reduces reliance on speculation and identifies hidden opportunities.
Common Pitfalls in Stock Market Analysis
Even experienced market participants fall into predictable traps. Being aware of these can save time, reduce losses, and improve decision quality:
Overreliance on One Technique: Ignoring sector dynamics or technical signals can result in missed warnings or overvalued selections.
Overcomplicating Technical Analysis: Using too many indicators or conflicting signals can create analysis paralysis. Focus on a few key high-impact metrics that are relevant to your strategy.
Neglecting Market Psychology: Investor sentiment often drives short-term price movements that fundamentals alone cannot explain. Failing to address this can result in poor timing or missed opportunities for reversal.
Weak Risk Management: Failing to conduct checks on volatility, exposure, and macroeconomic factors increases vulnerability to sudden market shifts.
Following Tips Blindly: Relying on rumours, media hype, or social chatter without structured validation exposes you to misinformation and impulsive decisions.
Ignoring Data Quality: Inconsistent, outdated, or biased data can lead to flawed conclusions, especially when combining multiple analysis types.
Also Read: Comparing Investment in Indian vs US Stock Markets
Tip: Develop a disciplined process, verify all data sources, and integrate multiple techniques to achieve a holistic view. Awareness of common pitfalls ensures more resilient, informed decision-making.
Conclusion
Stock market analysis provides a structured framework to make informed investment decisions. Fundamental analysis shows value, technical analysis times trades, derivatives reveal market sentiment, and industry analysis tracks sector trends. Combining these approaches with research tools enables investors to make informed, disciplined choices across equities, alternative assets, and private market opportunities.
Beyond traditional stocks, platforms like Precize offer access to private equity and private credit opportunities in India. This provides a means to explore structured, alternative options alongside your analysis of public companies.
Reserve your access with Precize and discover how private market opportunities can complement your understanding of company value!
FAQs
1. How should a beginner choose which analysis to start with?
A. Focus on your goal. For long-term growth, begin with fundamental analysis to assess value. For short-term trades, use technical analysis to spot trends. Industry analysis provides context, and derivatives suit advanced risk management. Start with fundamentals and industry insights, then gradually add technical or derivative tools as you gain experience.
2. Can industry analysis predict stock performance on its own?
A. No. Industry analysis shows sector health and growth potential but cannot guarantee stock returns. Combining it with company fundamentals and technical trends gives a clearer picture, helping allocate investments strategically across sectors instead of relying on a single stock.
3. How do derivatives reflect market sentiment?
A. Option and futures activity shows investor expectations on price movement and volatility. Metrics such as implied volatility and open interest reveal market optimism or fear, helping investors anticipate risk and adjust their strategies before price changes occur.
4. Can technical and fundamental analysis be combined effectively?
A. Yes. Use fundamental analysis to identify strong companies, then apply technical analysis to time trades. This approach ensures investment in high-quality stocks while selecting optimal entry and exit points, thereby reducing reliance on guesswork.
5. How often should stocks and sectors be re-evaluated?
A. Fundamentals: quarterly or semi-annually, tracking earnings and growth. Industry trends: when regulations or market conditions change. Technicals: daily or weekly, based on trade frequency. Regular updates ensure that decisions align with current market conditions.
Disclaimer
The content in this blog is intended for educational and informational purposes only. It explains different types of stock market analysis and how they can help you understand market trends, company performance, and sector dynamics. This information is not a recommendation to buy, sell, or take any financial action. You should evaluate your own goals, risk tolerance, and consult financial professionals before making any decisions related to markets or investments.

Stay in the Loop
Join our newsletter for exclusive access to thoughtfully curated content and we promise, no spam


Company
Our Office
Office No. 1219, The Summit Business Park, Andheri Kurla Road, Andheri East, Mumbai, Maharashtra - 400093
Find us on Googlesupport@precize.in
+91 7738336457
All trademarks and logos or registered trademarks and logos found on this Site or mentioned herein belong to their respective owners and are solely used for informational and educational purposes.
The material presented in this advertisement is for informational purposes only and should not be construed as investment advice or investment availability. It is not a recommendation of, or an offer to sell or solicitation of an offer to buy, any particular unlisted share, security, strategy, or investment product. Investing in the private market and securities involves risks, including the potential loss of money, and past performance does not guarantee future results. Market trends, data interpretations, graph projections are provided for informational and illustrative purposes and may not reflect actual future performance. Nothing on this website should be construed as personalized investment advice or should not be treated as legal, financial, or any other form of advice. Precize is not liable for financial or any other form of loss incurred by the user or any affiliated party based on information provided herein.
Precize is neither a stock exchange nor does it intend to get recognized as a stock exchange under the Securities Contracts Regulation Act, 1956. Precize is not authorized by the capital markets regulator to solicit investments. The securities traded on these platforms are not traded on any regulated exchange.
The website will be updated regularly.
Copyright © 2026 - Precize - All Rights Reserved