Top 7 Stock Valuation Methods to Understand Company Value

It’s easy to feel lost when trying to figure out what a company’s shares are really worth. Numbers, ratios, and market chatter can make it seem like everyone has a different answer.
You might have asked yourself why one calculation shows one value while another says something completely different. The real challenge is knowing which stock valuation methods actually give a clear picture.
In this blog, you will get a step-by-step understanding of stock valuation, starting with what stock valuation is and why it matters. We will explain the top 7 methods and common mistakes to avoid.
Let’s get started!
Quick Overview
Stock valuation methods help you understand a company’s true worth from different angles.
Absolute methods like DCF, Dividend Discount, and Residual Income focus on the company’s own financials.
Relative methods like P/E, P/B, P/S, and EV/EBITDA compare a company with its peers or industry averages.
Avoid common mistakes like unrealistic growth assumptions, ignoring debts, or relying on a single method.
What Stock Valuation is About?
Stock valuation is the process of assessing the worth of a company’s shares by analysing its financial statements, assets, earnings, and market conditions. It provides a systematic way to estimate a stock’s value using different stock valuation methods.
With the basics of stock valuation clear, it’s time to explore the key methods that help you put numbers to a company’s worth.
7 Best Stock Valuation Methods
When it comes to understanding stock valuation methods, several widely used approaches help determine the fair value of a company’s shares. Each method has its own focus and is suitable for different types of companies or financial situations. Here is a detailed look at the main methods:
1. Relative Valuation Methods
Relative valuation methods help you compare a stock’s value to other similar companies or industry benchmarks. These methods are useful if you want to see if a stock is over- or undervalued in the market.

Price-to-Earnings (P/E) Ratio
The P/E ratio shows you how the market price of one share compares to the company’s earnings per share. It basically tells you how much you are paying for ₹1 of earnings.
Best For: You can use this to compare companies in the same sector and see which ones are over- or undervalued.
Formula: P/E Ratio = Market Price per Share / Earnings per Share (EPS)
Example: If a share costs ₹200 and the EPS is ₹10:
P/E = 200 / 10 = 20
Pros: You can calculate it easily, and it is widely used for quick comparisons.
Cons: It doesn’t account for company growth, debt levels, or other financial factors.
Price-to-Book (P/B) Ratio
The P/B ratio helps you see how the stock price compares to the company’s net assets (book value) per share.
Best For: This is useful if you are looking at asset-heavy companies like banks or manufacturing firms.
Formula: P/B Ratio = Market Price per Share / Book Value per Share
Example: If the share price is ₹150 and the book value per share is ₹100:
P/B = 150 / 100 = 1.5
Pros: You can use it when tangible assets are important.
Cons: It does not consider intangible assets like brand value or intellectual property.
Price-to-Sales (P/S) Ratio
This ratio helps you understand how the stock price compares to revenue generated per share. It’s useful when profits are low or inconsistent.
Best For: You can use this for companies with strong sales but irregular earnings.
Formula: P/S Ratio = Market Price per Share / Sales per Share
Example: If the share price is ₹120 and sales per share are ₹40:
P/S = 120 / 40 = 3
Pros: Helps you when earnings are unstable.
Cons: Sales alone do not tell you whether the company is profitable.
Price-to-Cash Flow (P/CF) Ratio
This ratio shows you how the stock price compares to cash generated per share from operations. It focuses on actual cash rather than accounting profits.
Best For: You can use it for companies with strong cash flow but unpredictable earnings.
Formula: P/CF Ratio = Market Price per Share / Cash Flow per Share
Example: If the share price is ₹100 and the cash flow per share is ₹20:
P/CF = 100 / 20 = 5
Pros: It shows you the real cash the company generates.
Cons: It does not consider non-cash factors that may affect future cash flows.
2. Absolute Valuation Methods
Absolute valuation methods estimate the intrinsic value of a stock based entirely on the company’s own financials, without comparing it to other companies. You use these methods when you want to know what a stock is really worth on its own.
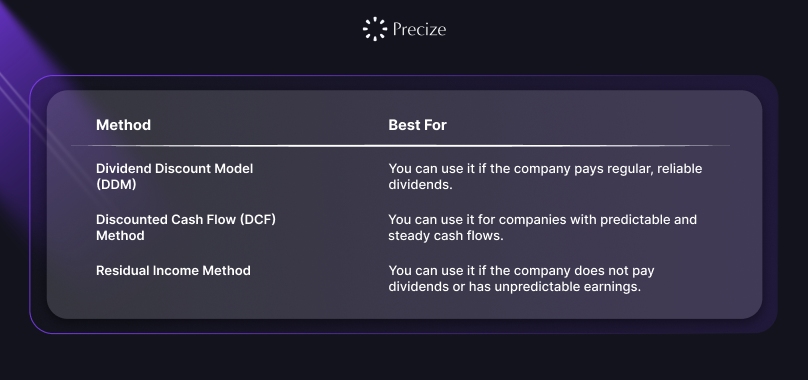
Dividend Discount Model (DDM)
The DDM helps you value a stock based on expected future dividends, discounted to their present value.
Best For: You can use it if the company pays regular, reliable dividends.
Formula: Stock Value = D1 / (r - g)
Where:
D1 = Dividend expected next year
r = Required rate of return
g = Dividend growth rate
Example: If the next year’s dividend is ₹5, the growth rate is 5%, and the required return is 10%:
Stock Value = 5 / (0.10 - 0.05) = ₹100
Pros: Shows you the cash returned to shareholders.
Cons: Not useful if the company does not pay dividends.
Discounted Cash Flow (DCF) Method
The DCF method lets you estimate a stock’s value by projecting the company’s future free cash flows and discounting them to the present.
Best For: You can use it for companies with predictable and steady cash flows.
Formula:DCF = Σ (FCFt / (1 + r)^t) + TV / (1 + r)^N
Where:
FCFt = Free cash flow in year t
r = Discount rate
TV = Terminal value
N = Number of years projected
Example: Estimate cash flows for 5 years, discount them back to today, and add the terminal value for cash flows beyond year 5.
Pros: Based on the company’s fundamentals and long-term cash generation.
Cons: Sensitive to assumptions like growth rate, discount rate, and terminal value; requires careful data.
Residual Income Method
The Residual Income Method calculates stock value by adding the present value of residual income (profit above the cost of equity) to the company’s book value.
Best For: You can use it if the company does not pay dividends or has unpredictable earnings.
Formula:
Residual Income = Net Income - (Equity Capital × Cost of Equity)
Stock Value = Book Value + Σ (Residual Income t / (1 + r)^t)
Example: If net income is ₹50 crores, equity capital is ₹400 crores, and cost of equity is 10%:
Residual Income = 50 - (400 × 0.10) = 10 crores
Pros: Takes into account the cost of capital and quality of earnings.
Cons: Complex to calculate and requires accurate forecasts.
3. Enterprise Value Multiples (EV/EBITDA)
EV/EBITDA compares the total value of a company, including debt and cash, to its earnings before interest, taxes, depreciation, and amortization. It gives a clearer picture than P/E if companies have different debt levels.
Best For: Comparing companies with different capital structures, especially across industries.
Formula: EV/EBITDA = Enterprise Value / EBITDA
Where:
Enterprise Value (EV) = Market Capitalization + Total Debt – Cash
EBITDA = Earnings before interest, taxes, depreciation, and amortization
Example: If Enterprise Value = ₹5000 crores and EBITDA = ₹500 crores:
EV/EBITDA = 5000 / 500 = 10
Pros: Accounts for debt and cash, making comparisons more accurate.
Cons: Can be misleading if EBITDA is volatile or if counting practices differ.
With the top valuation methods covered, the next step is to understand the pitfalls that can lead to inaccurate assessments.
Common Mistakes in Stock Valuation Methods
When you try to value stocks, avoiding common mistakes is important to get a realistic and accurate picture. Here are some errors you should watch out for:
1. Choosing the Wrong Comparables
If you compare companies that differ in size, sector, or risk, your results can be misleading. Make sure the companies you use for comparison have similar characteristics to get meaningful insights.
2. Ignoring Risks and Discount Rates
Underestimating risks or applying the wrong discount rate can inflate the stock’s value. Always consider market risks, industry challenges, and company-specific factors, and use an appropriate discount rate, such as the Capital Asset Pricing Model (CAPM).
3. Making Unrealistic Growth Assumptions
Assuming very high growth rates can push valuations too far. Base your projections on historical data and realistic market conditions to avoid overestimating.
4. Overlooking Changes in Working Capital
Ignoring changes in working capital can distort your cash flow estimates, affecting the stock’s value. Adjust your calculations to account for actual working capital needs that support the company’s growth.
5. Relying on Only One Valuation Method
Using just a single method limits your perspective. Combine approaches like discounted cash flow, dividend discount, and relative valuation to get a more balanced and accurate view.
6. Ignoring Debts and Liabilities
If you fail to include a company’s debts, you might overstate its actual value. Always account for total liabilities when calculating a stock’s worth.
7. Overvaluing Low Ratios
Low P/E or P/B ratios don’t automatically mean a stock is cheap. They might reflect weak performance or uncertain prospects, so evaluate these ratios carefully.
8. Assuming Market Price Equals True Value
Market prices can swing due to sentiment, news, or short-term trends. Remember, true value comes from fundamentals, not just what the market price shows.
Conclusion
By now, you can see that stock valuation methods give you multiple ways to understand a company’s worth. Absolute methods like DCF, Dividend Discount, and Residual Income focus on a company’s own financials, while relative methods such as P/E, P/B, P/S, and EV/EBITDA let you compare it with peers. Each approach has its purpose, and using a combination helps you form a clearer, more accurate picture.
Beyond traditional stocks, platforms like Precize offer access to private equity and private credit opportunities in India. This gives you a way to explore structured, alternative options alongside your analysis of public companies.
Reserve your access with Precize and discover how private market opportunities can complement your understanding of company value!
FAQs
1. How do valuation methods differ between startups and established companies?
Startups often have irregular or negative earnings, so traditional ratios like P/E or P/B may not be useful. In such cases, you can rely on cash flow projections, EV/EBITDA, or benchmarking against similar early-stage companies. For established companies, both absolute and relative methods work well because their financials are more stable.
2. Can stock valuation methods guarantee future performance?
No method can predict the future with certainty. Valuations estimate a stock’s fair value based on current data and projections, but market conditions, sector trends, and economic changes can affect outcomes. Using realistic assumptions and multiple valuation methods can give you a more balanced perspective.
3. How often should I review stock valuations?
Valuations should be updated when there are significant changes in a company’s financials, dividend policies, or market conditions. Even small shifts in interest rates, industry trends, or risk factors can affect stock value. Regular reviews help you maintain accurate and relevant estimates.
4. What should I avoid when comparing stocks across sectors?
Different sectors have unique characteristics, such as capital requirements, growth patterns, and risk levels. Avoid comparing companies solely based on simple ratios like P/E or P/B. Instead, consider sector-specific factors like cash flow stability, asset intensity, and competitive dynamics for a more meaningful comparison.
Disclaimer
The information provided in this blog is intended for educational and informational purposes only. It explains various stock valuation methods and techniques to help you understand company value from different perspectives. This information is not a recommendation to buy, sell, or take any financial action. You should carefully consider your own needs and consult professionals before making any financial decisions.

Stay in the Loop
Join our newsletter for exclusive access to thoughtfully curated content and we promise, no spam


Company
Our Office
Office No. 1219, The Summit Business Park, Andheri Kurla Road, Andheri East, Mumbai, Maharashtra - 400093
Find us on Googlesupport@precize.in
+91 7738336457
All trademarks and logos or registered trademarks and logos found on this Site or mentioned herein belong to their respective owners and are solely used for informational and educational purposes.
The material presented in this advertisement is for informational purposes only and should not be construed as investment advice or investment availability. It is not a recommendation of, or an offer to sell or solicitation of an offer to buy, any particular unlisted share, security, strategy, or investment product. Investing in the private market and securities involves risks, including the potential loss of money, and past performance does not guarantee future results. Market trends, data interpretations, graph projections are provided for informational and illustrative purposes and may not reflect actual future performance. Nothing on this website should be construed as personalized investment advice or should not be treated as legal, financial, or any other form of advice. Precize is not liable for financial or any other form of loss incurred by the user or any affiliated party based on information provided herein.
Precize is neither a stock exchange nor does it intend to get recognized as a stock exchange under the Securities Contracts Regulation Act, 1956. Precize is not authorized by the capital markets regulator to solicit investments. The securities traded on these platforms are not traded on any regulated exchange.
The website will be updated regularly.
Copyright © 2026 - Precize - All Rights Reserved