Fractal Analytics has become one of the most closely watched names in India’s AI and analytics space, and its public-market move has drawn attention to one question: how is the company being valued across different stages? With news reports citing a potential US$3.5 billion reference point and a recent private transaction placing the Fractal Analytics valuation near US$2.44 billion, many readers want clarity on what these numbers mean, how they differ, and which one matters during the IPO phase.
In this guide, you’ll find a clear, structured explanation that helps you understand these valuation checkpoints without speculation.
Key Takeaways
Primary Valuation Checkpoints: Fractal’s valuation has moved through verified milestones, including its DRHP filing, ₹4,900 crore IPO structure, FY25 financial disclosures, and the US$2.44B private secondary transaction.
Different Valuation Frameworks: Valuation shifts across 4 stages, secondary transactions, filing-based assessments, IPO pricing, and post-listing trading, each relying on different disclosures and equity structures.
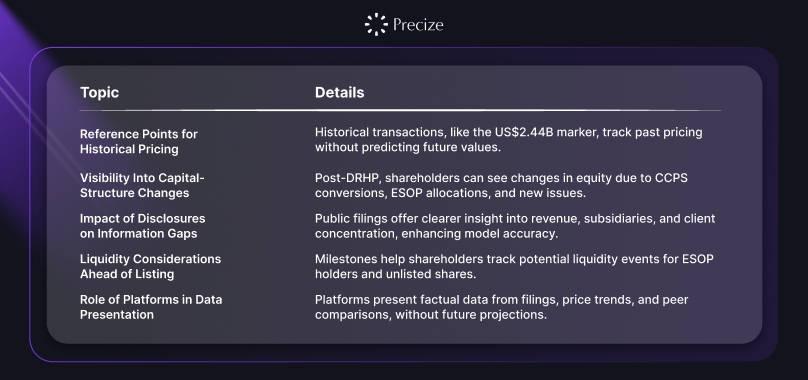
How the $2.44B Figure Fits: The US$2.44B valuation represents a private negotiated transaction and serves as a historical reference, not a predictor of IPO or listing-day valuation.
Scenario Models Behind 2025 Estimates: Analysts examine pre-offer equity, post-offer dilution, revenue mix, subsidiary outcomes, and balance-sheet structure to build non-speculative valuation scenarios.
Factors That Influence Interpretation: Revenue scale, margin patterns, client concentration, subsidiary performance, and capital structure shape how market participants may interpret valuation once full disclosures are reviewed.
Quick Facts: Fractal Analytics Valuation Milestones So Far
Fractal Analytics’ valuation has moved through several clear checkpoints across private transactions and regulatory activity. These events form the reference points that analysts, institutions, and private-market participants rely on when discussing how the company may be valued in 2025.
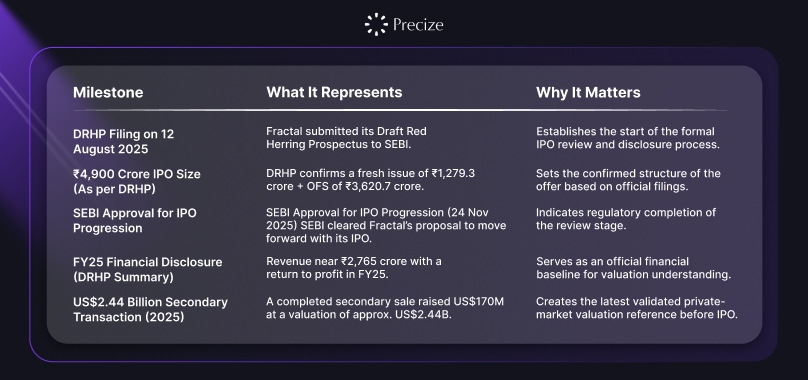
These milestones set the backdrop for how valuation is interpreted across different stages, which makes it useful to break down what each valuation type actually represents in practice.
Fractal Analytics Valuation Basics: What Different Types Mean
A company’s valuation transforms as it moves through private transactions, regulatory filings, and public-market pricing. Each stage uses a different calculation method and relies on a different information set. For Fractal Analytics, these stages are now easier to track because the company filed its Draft Red Herring Prospectus (DRHP) with SEBI on 12 August 2025 and received SEBI approval on 18 November 2025, establishing the official disclosure baseline.
Here is a detailed breakdown built around Indian regulatory practices and how valuation is actually computed at each stage.
Secondary Valuation: Calculated From a Share-Transfer Price
A secondary valuation is derived directly from the per-share transfer price when existing shareholders sell equity to a new party.
How the valuation is computed:
Take the agreed per-share transfer price
Multiply it by the company’s fully diluted share count at that time
The result becomes the implied private-market valuation
Why this matters technically:
Only existing shares change hands
The valuation reflects the price insiders accepted
Fully diluted share count includes ESOPs, preference conversions, and outstanding commitments
Example structure (illustrative, not using repeated numbers): If a buyer acquires shares at ₹X during a secondary transfer, valuation = ₹X × total diluted shares.
Key insight: Secondary valuation reflects negotiated pricing inside a closed transaction, not a market-wide bid.
Filing-Based View: Built From SEBI-Mandated Disclosures
A filing-based valuation is not a “number” inside the DRHP. Instead, it is constructed by analysts using information that SEBI requires companies to disclose.
What this view includes:
Total equity before the offer
Total equity after conversion of CCPS and ESOPs
Fresh issue size
OFS volume
Segment-level performance
Revenue concentration by customer
Debt positions
Subsidiary-level results
Auditor observations
Cash-flow structure
Geographical contribution
Why this matters technically:
These inputs allow analysts to model scenarios
No price is set yet
This is the only point in the process where audited information and operational detail are available before a public offer
Key insight: A filing-driven view is built entirely from SEBI-reviewed disclosures and forms the baseline for subsequent valuation work.
IPO Valuation: Determined Through the Book-Building Framework
IPO valuation in India is calculated only after the price band is released.
It comes from two components:
A. Issue Price (Final Offer Price)
Set after analysing:
Institutional demand
Investor bids inside the price band
Allocation rules under SEBI guidelines
Market conditions during the bidding window
B. Total Outstanding Equity After Fresh Issue
This includes:
Pre-offer equity
Newly issued shares from the fresh issue
Converted CCPS, if any
ESOP pool adjustments
Formula: IPO Valuation = Final Offer Price × Total Outstanding Equity After Fresh Issue
Key insight: This is the first valuation directly shaped by public demand rather than private negotiation.
Post-Listing Valuation: Determined by Live Trading
This valuation is built from:
Real-time market trades
Opening auction on listing day
Buy/sell quantity at each price level
Institutional participation on listing day
Retail trading volume
Free-float available to the public
Formula: Post-Listing Valuation = Market Price × Total Outstanding Shares
Why it matters technically:
It reflects the first broad-market consensus
It may diverge sharply from the IPO valuation, depending on trading interest
It becomes the reference point for future institutional entry
Key insight: Post-listing valuation is the only form driven entirely by market activity without influence from negotiated or regulatory processes.
With the milestone events mapped out, the natural progression is to see how each valuation type is defined and calculated across Fractal’s funding and regulatory stages.
If you want to deepen your market knowledge before reviewing upcoming offers, take a look at what is IPO grading?
Scenario Models for Fractal Analytics Valuation (Core: Non-Advisory, Analytical)
Valuation outcomes shift depending on which inputs analysts use after a company files its DRHP. Since no official price band is available yet, scenario modelling helps clarify how different elements of the filing influence valuation. These are analytical structures, not forecasts.
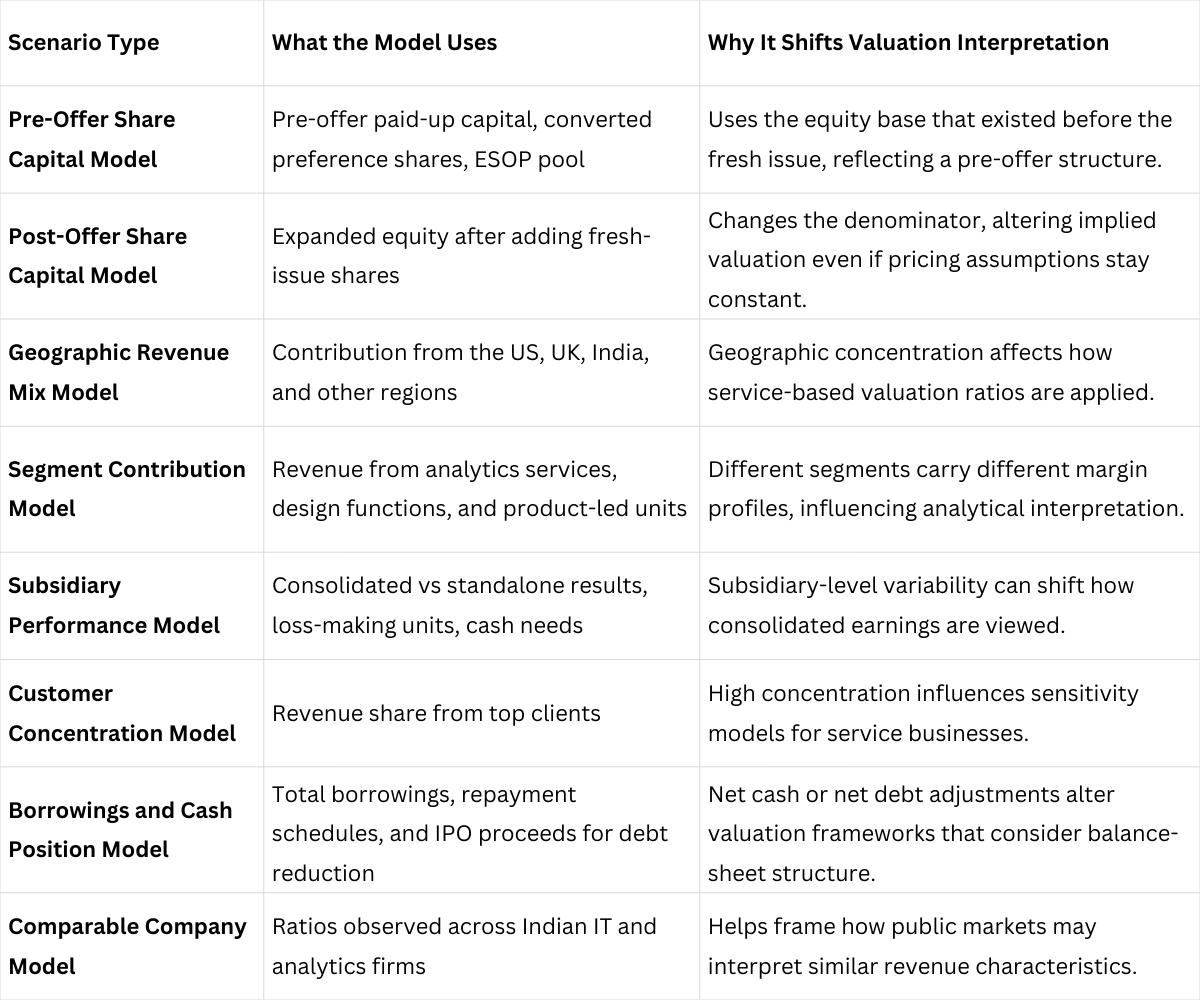
Once the scenario structures are clear, the focus shifts to how valuation frameworks are compared across similar companies in the analytics and AI-services segment.
If you're comparing valuation signals across upcoming offers, you may find added clarity by reviewing structured methods discussed in IPO investment strategies: maximizing returns with informed decisions
Peers and Comparable Multiples: Cautious Benchmarking
Comparing an analytics and AI-services company during the IPO stage requires careful classification because Indian and global markets group such firms based on delivery structure, contract depth, and revenue patterns rather than broad sector labels.
Public analysts typically create peer brackets using DRHP disclosures to avoid mismatching business models that may look similar on the surface but differ materially in execution and earnings.
Revenue Composition–Based Peer Grouping: Benchmarking begins with how revenue is split across analytics services, engineering work, design capabilities, and platform-led functions. A company with a higher share of recurring analytics programs falls into a different analytical bracket than firms driven mostly by short-cycle engineering assignments.
Engagement Depth and Renewal Patterns: Peers are grouped based on the length and nature of client engagements, multi-year analytics mandates, managed-services contracts, and continuous decision-support programs are benchmarked separately from project-based or outcome-linked assignments.
Delivery-Center Cost Architecture: Public-market analysts consider delivery location mix (India vs. outside India), average employee cost, and utilisation patterns. This allows comparability with firms that follow similar talent pyramids rather than those operating with materially different cost structures.
Geographic Revenue Dependence: Companies generating a high share of revenue from the United States are usually compared within a bracket that reflects North America-led demand cycles, while firms with a broader regional distribution are grouped differently due to varying macro cycles.
Operational Cash Generation and Balance-Sheet Structure: Peer comparison also considers whether earnings translate into cash consistently, how much working capital the business requires, and how debt or cash reserves influence valuation ratios that depend on capital structure.
These milestones set the stage for a clearer view of how valuation frameworks operate at different points in Fractal Analytics’ journey.