Stock Analysis: Overview, Methods and Tools

Have you ever wondered why some people stay ahead in the stock market while others struggle to keep up? The secret often lies in effective stock price analysis. Whether you're tracking market trends, evaluating a company’s growth potential, or simply trying to figure out why a stock's price is skyrocketing or dropping, stock analysis is the key to unlocking these answers.
In this blog, we’ll simplify everything you need about stock analysis. We’ll start with the basics—what stock analysis is and why it’s important. Next, we’ll explore the two main methods: Fundamental Analysis and Technical Analysis.
You’ll also learn about the essential tools for effective stock price analysis and how blending these methods can give you a better understanding of market behavior. By the end, you’ll have a clear idea of how stock analysis works and how it can help you interpret the financial markets and understand stock price changes confidently.
Curious to learn more? Keep reading!
What is Stock Analysis?
Stock analysis helps you understand why stock prices move the way they do. By studying company reports, financial statements, and stock price patterns, you can understand what influences a stock's value.
For example, a company’s revenue, profit, debt levels, and industry position often play a major role. Similarly, external factors like economic trends, government policies, and global markets also impact stock prices.
Knowing what stock analysis entails is one thing, but understanding its importance takes your knowledge to the next level. Here’s why it matters.
Why is Stock Analysis Important?

Understanding stock analysis is essential for you to navigate the stock market effectively. Here are some key reasons why it’s important:
Informed Decision-Making
Stock analysis gives valuable insights into a company’s financial health and market position. By examining past and present data, you can make better decisions about buying, selling, or holding a stock. This helps you avoid impulsive actions based on rumors or market buzz.
Identifying True Value
Stock analysis helps you uncover the real value of a company, which might not always match its current market price. By evaluating factors like earnings, revenue growth, and market conditions, you can identify undervalued stocks with potential for future growth.
Risk Management
Analyzing stocks allows you to identify risks, such as company financial performance issues or market volatility. Understanding these risks helps you strategically safeguard your portfolio from losses.
Portfolio Optimization
Regular stock analysis helps you review and refine your portfolio. By assessing the performance of your investments, you can decide which stocks to hold, sell, or add, ensuring your portfolio remains in line with your financial objectives.
Market Trend Awareness
Stock analysis keeps you updated on market trends and changes in investor sentiment. Recognizing these trends can help you time your market entries and exits more effectively, maximizing returns and reducing losses.
Knowing why stock analysis is crucial is important, but how do you go about it? Let’s look at the most common methods.
Common Methods of Stock Analysis

When analyzing stocks, it’s essential to understand the different methods available. Each method offers unique insights into stock performance, helping you make sense of the market and evaluate your options. Here are the main methods of stock analysis:
Fundamental Analysis
Fundamental analysis is finding a stock’s actual value by looking beyond short-term price changes. Long-term investors widely use fundamental analysis to identify stocks with strong growth potential. It examines a company’s financial health, position within the industry, and overall economic environment.
Key Components of Fundamental Analysis
Economic Analysis: This involves studying GDP growth, inflation, and interest rates. These indicators help you understand the market conditions that affect a company’s performance.
Industry Analysis: Evaluate the company’s industry, including trends, competition, and growth potential. Understand how the company stands against its peers and adapts to market dynamics.
Company Analysis: This includes reviewing financial statements such as income statements, balance sheets, and cash flow statements. Key metrics include:
Earnings Per Share (EPS): Measures a company’s profitability per share.
Price-to-Earnings (P/E) Ratio: Compares stock price to earnings to determine valuation.
Debt-to-Equity Ratio: Assesses financial risk by comparing debt to shareholder equity.
Return on Equity (ROE): Indicates how effectively shareholder funds generate profit.
Net Profit Margin: This shows the percentage of revenue converted into profit.
Current Ratio: Evaluate the company’s ability to cover short-term obligations.
Quick Ratio: Similar to the current ratio but excludes inventory for stricter liquidity analysis.
Free Cash Flow (FCF): Represents cash available after expenses, showing financial flexibility.
Dividend Yield: Highlights dividend returns as a percentage of the stock price.
Management Quality: Analyze the leadership team’s experience and track record. A strong management team is key to the company’s growth and stability.
Steps in Conducting Fundamental Analysis
Assess the overall economic environment.
Analyze the company’s financial reports.
Forecast its future performance based on past trends.
Calculate the stock’s intrinsic value to determine if it’s undervalued or overvalued.
Technical Analysis
Technical analysis looks at past price movements and trading volumes to predict future trends. It focuses on patterns and market behavior, rather than a company’s financials. This method is commonly used by traders who focus on short-term market opportunities.
Key Components of Technical Analysis
Charts and Graphs: Price charts, like candlestick, bar, or line charts, help visualize stock trends over time. Patterns such as support and resistance levels are crucial for analysis.
Technical Indicators: These tools help identify trading signals. Common indicators include:
Moving Averages: Smooth price data over a specific period to highlight trends.
Relative Strength Index (RSI): Detects whether a stock is overbought or oversold.
MACD (Moving Average Convergence Divergence): Shows the relationship between two moving averages to identify momentum.
Steps in Conducting Technical Analysis
Choose a time frame for analysis, depending on whether you’re looking at short-term or long-term trends.
Study price charts for patterns or signals.
Apply technical indicators to confirm trends.
Decide when to enter or exit a trade based on the insights.
Sentiment Analysis
Sentiment analysis evaluates how investors feel about a stock or the market in general. It captures the emotions and opinions that drive buying or selling decisions. Sentiment analysis benefits volatile markets where emotions can drive sudden price changes.
Key Components of Sentiment Analysis
Social Media Monitoring: Platforms like X (Twitter) reveal what investors discuss. Monitoring these platforms can provide a sense of market excitement or concern.
News Articles and Reports: News about a company, industry, or market event often impacts investor sentiment. Positive news can boost stock prices, while negative reports might cause declines.
Steps in Conducting Sentiment Analysis
Monitor social media and news for discussions or events affecting stocks.
Assess how these insights align with market trends.
Combine sentiment findings with other analysis methods for a well-rounded perspective.
Quantitative Analysis
Quantitative analysis uses data, mathematical models, and statistical techniques to evaluate stocks. It focuses on finding patterns and correlations to identify opportunities. Quantitative analysis is commonly used by institutional investors and traders who rely on data-driven strategies.
Key Components of Quantitative Analysis
Data Collection: Gather historical data on prices, volumes, and market indicators.
Statistical Techniques: Use methods like regression analysis to uncover trends and patterns in the data.
Steps in Conducting Quantitative Analysis
Define the variables and models you want to analyze, such as price trends or trading volumes.
Collect relevant historical data for the stock or market.
Analyze the data using software tools and algorithms.
Use the results to guide your decisions.
With the methods of stock analysis in mind, the next step is to look at the tools that make this process more efficient and insightful.
Essential Tools for Stock Analysis
To analyze stocks effectively, you need the right tools that provide insights into market trends, company performance, and overall economic conditions. Here are some essential tools for stock price analysis:
Technical Indicators and Chart Patterns
Technical indicators and chart patterns help you identify trends, momentum, and potential price movements in the stock market. Traders widely use these tools for short-term decision-making based on market behavior.
Candlestick Charts: Visualize price movements and identify patterns like bullish or bearish trends.
Moving Averages: Highlight trends by smoothing out short-term price fluctuations.
Relative Strength Index (RSI): Measures overbought or oversold conditions based on price changes.
Bollinger Bands: Show volatility by plotting price levels around a moving average.
MACD (Moving Average Convergence Divergence): Tracks momentum and potential trend reversals.
Macroeconomic Data and Company Financial Statements
Understanding the broader economic environment and a company’s financial health is crucial for making informed decisions. These tools are essential for fundamental analysis, especially if you are a long-term investor.
Macroeconomic Indicators: Factors like GDP growth, inflation, interest rates, and employment data provide context for market conditions.
Financial Statements: Analyze a company’s balance sheet, income statement, and cash flow statement to assess profitability, liquidity, and stability.
Key metrics include EPS, P/E ratio, and ROE.
Support and Resistance Lines
Support and resistance levels are key concepts in technical analysis. Identifying these levels helps determine entry and exit points and understand price trends.
Support Lines: Indicate a price level where demand is strong enough to prevent further decline.
Resistance Lines: Show a price level where selling pressure prevents further price increases.
Stock Screeners and Research Platforms
Stock screeners filter stocks based on specific criteria like price, market cap, or financial ratios. Research platforms offer detailed insights, including analyst reports and market news. Examples include:
Screeners: Tools help find stocks that meet your criteria.
Platforms: Websites like Moneycontrol and NSE India provide financial data and market updates tailored to Indian audiences.
Economic Calendars
Economic calendars track key events like interest rate announcements, GDP releases, and corporate earnings reports. These events can significantly impact stock prices, making them essential for planning trades or investments.
Algo-Trading and Quantitative Tools
Advanced tools for quantitative analysis and algorithmic trading use data-driven models to identify patterns and automate trades. Experienced traders or institutions often use these.
Equipped with these tools, it’s time to see how combining different analysis techniques can give you a clearer picture of stock performance.
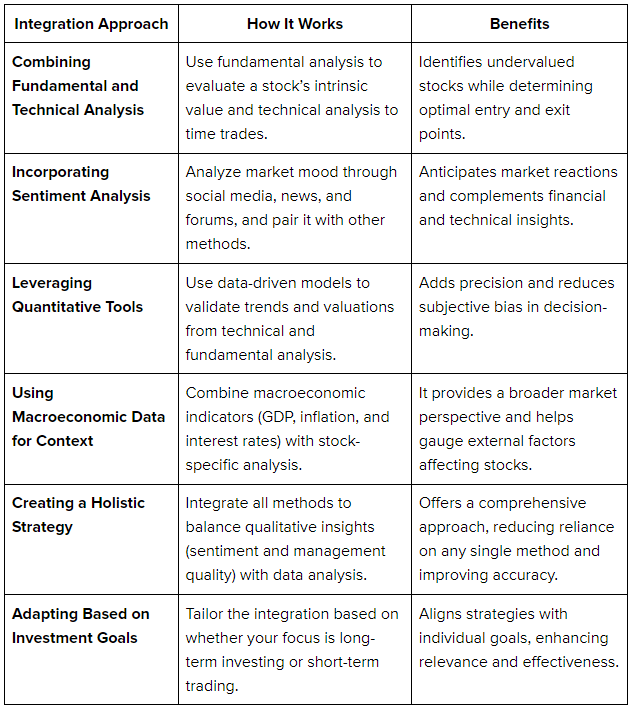
Integrating Analysis Methods
Stock analysis becomes more effective when you combine different methods to get a well-rounded view of the market and specific stocks. Each approach—fundamental, technical, sentiment, and quantitative—offers unique insights, and integrating them can help you make more informed decisions. Here's how these methods can work together:
Conclusion
Stock price analysis plays a vital role in helping you navigate the complexities of the stock market. By understanding and combining different methods like fundamental and technical analysis, you can gain unique insights into market behavior and identify opportunities that align with your financial goals.
Utilizing the right tools enhances your ability to conduct stock price analysis effectively, ensuring better timing and informed stock selection.
Precize is an alternative investment platform in India that specializes in access to global trade finance and pre-IPO shares opportunities for those exploring new opportunities. It allows you to diversify your portfolio with innovative solutions.
Reserve your access with Precize now and unlock global trade finance opportunities designed for portfolio diversification.

Stay in the Loop
Join our newsletter for exclusive access to thoughtfully curated content and we promise, no spam


Company
Our Office
Office No. 1219, The Summit Business Park, Andheri Kurla Road, Andheri East, Mumbai, Maharashtra - 400093
Find us on Googlesupport@precize.in
+91 7738336457
All trademarks and logos or registered trademarks and logos found on this Site or mentioned herein belong to their respective owners and are solely used for informational and educational purposes.
The material presented in this advertisement is for informational purposes only and should not be construed as investment advice or investment availability. It is not a recommendation of, or an offer to sell or solicitation of an offer to buy, any particular unlisted share, security, strategy, or investment product. Investing in the private market and securities involves risks, including the potential loss of money, and past performance does not guarantee future results. Market trends, data interpretations, graph projections are provided for informational and illustrative purposes and may not reflect actual future performance. Nothing on this website should be construed as personalized investment advice or should not be treated as legal, financial, or any other form of advice. Precize is not liable for financial or any other form of loss incurred by the user or any affiliated party based on information provided herein.
Precize is neither a stock exchange nor does it intend to get recognized as a stock exchange under the Securities Contracts Regulation Act, 1956. Precize is not authorized by the capital markets regulator to solicit investments. The securities traded on these platforms are not traded on any regulated exchange.
The website will be updated regularly.
Copyright © 2026 - Precize - All Rights Reserved